

Photo by Arina Krasnikova
Almost Half of Stock Pickers Beat the Market in Early 2022 Selloff read the WSJ News Exclusive headline on Thursday 9/15/22. The story goes on to explain that this year’s middling performance is the best year for active stock pickers since 2009!
For ATX Portfolio Advisors® clients and Accountable Update readers, that probably is no surprise. In fact, as I pointed out in an April 2019 Accountable Update titled Mutual Fund Landscape, there are normally fewer than 25% of actively managed funds that tend to survive and outperform their benchmarks.
In case you are curious, those figures from 2019 are updated every year by Dimensional Funds’ Fund Landscape report. This year’s edition does show a relatively good run for active managers, with 26% beating benchmarks for the past 10 years. (Relatively being the operative word, as only 18% have won over the past 20 years.) I suppose congratulations are in order?
All kidding aside, if you follow the messaging from the active management community, volatile years like this should provide stock pickers the opportunity to outperform with their superior wit and resources. However, looking back at active US-domiciled equity funds’ performance finds no meaningful relation between market volatility and managers’ success rates.
The rolling three-year standard deviation for US stock market returns, illustrated by the orange line in Exhibit 1, shows recent volatility has been at its highest since the 2008 financial crisis. The rolling three-year outperformance rates by active US equity funds (blue bars) imply very little relation with volatility levels. The year-to-year variation in success rates does not consistently track market volatility. For example, rolling averages of daily volatility from 2014-2019 were consistent in level and yet the percentage of funds outperforming during these rolling periods was not, ranging from 23% to 37%.
Exhibit 1.

Value Rebounds
I have no particular dislike for those that try to make a living by picking stocks. It’s just that I spent the better part of my adult life working on that side of the business and grew weary of making excuses every year for underperformance that we charged premium management fees to achieve. The more I sought evidence that the active management approach added value, the more I became convinced that a better approach was to just buy value. Value stocks, that is. Value, as well as smaller and profitable stocks, have outperformed growth, large, and unprofitable stocks relatively over long periods of time. But no approach works all the time, and that has certainly been true for Value stocks.
Take, for example, the three-year period ending in June 2020. The Russell 1000 Value Index underperformed the Russell 1000 Growth Index by a whopping 17.2% annualized. However, since then, value has beat growth by 8.1% annualized through June 2022.
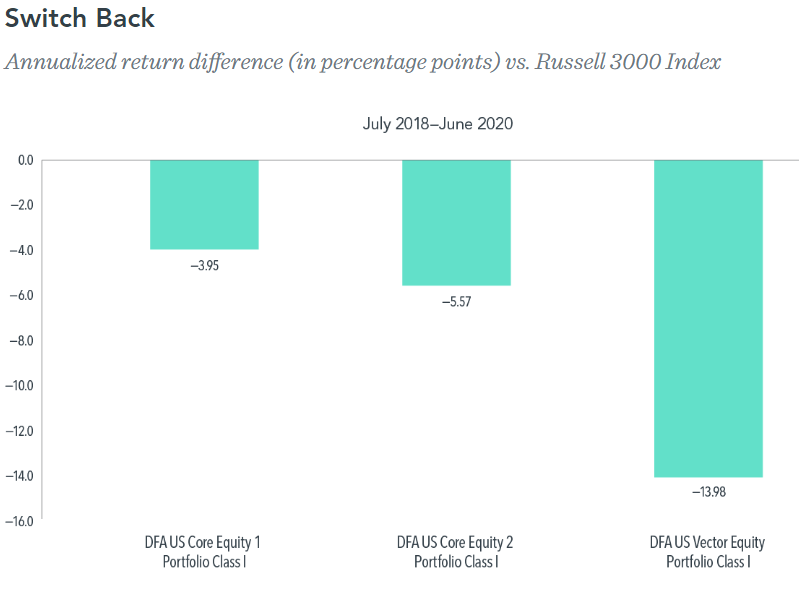
This is illustrated in Exhibit 2 by three Dimensional Funds that ATX Portfolio Advisors utilizes in our investment models. These US market wide strategies convey the range of outcomes for various levels of exposure to value stocks. During the underperforming period of 2018-2020, the US Core Equity 1 Portfolio (DFEOX) had the lowest exposure (or “tilt”) to value stocks and trailed the Russell 3000 Index by 3.95% per year. At the other end of the spectrum, US Vector Equity (DFVEX) had the highest exposure to value and trailed the index by 13.98%.
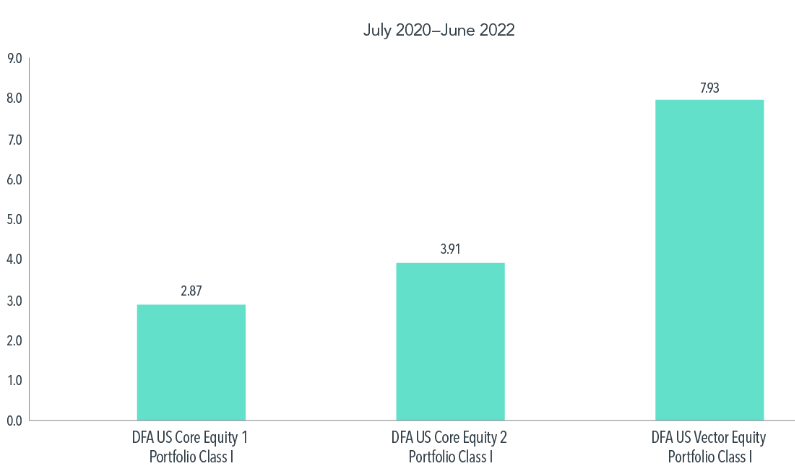
Since then, value’s rebound helped push DFEOX to a nearly 3% advantage over the market in the two-year period ending in June 2022. On the other hand, DFVEX’s heavier tilt led to outperformance of nearly 8% annually.
Exhibit 2.
In short, investors that used evidence based strategies to inform their investment decisions were likely rewarded for their staying in their seats while those that listened to the active management marketers’ rhetoric were less likely to have done so.
2022 has been challenging for all investors but by exercising discipline through periods of challenging performance, you can put yourself in the best position to capture periods of strong performance. There is no reward until you’ve paid for risk by sticking through turbulent times. If you need to see if you’re in the right seat, get in touch.
Exhibit 1. Market volatility computed each month using standard deviation of Fama/French Total US Market Research Index daily returns. Monthly volatility observations are then averaged over rolling three-year periods formed at the end of each year. Outperformance rates are computed over the same rolling three-year periods and are calculated as the percentage of active US-domiciled equity funds that survive the period and outperform their respective Morningstar category index net of all fees and expenses. Sample of active managers consists of funds categorized as active US equity by Morningstar. Fund returns are average returns computed each month, with individual fund observations weighted in proportion to their assets under management (AUM). Index benchmarks are those assigned by Morningstar based on the fund’s Morningstar category.
Source: Dimensional
Exhibit 2. Performance data shown represents past performance and is no guarantee of future results. Current performance may be higher or lower than the performance shown. The investment return and principal value of an investment will fluctuate so that an investor’s shares, when redeemed, may be worth more or less than their original cost. To obtain performance data current to the most recent month-end, visit us.dimensional.com.
Short-term performance results should be considered in connection with longer-term performance results.
Source: Dimensional. Returns in USD and net of all fees and expenses.