Newsletter

Q4 2015 Market Review

We Have Liftoff!

In our Q3 Market Review, we asked if it was time for "Liftoff", a.k.a. the rise in short-term interest rates expected when the Federal Reserve raised rates for the first time since 2006. The focus on that event, however, may have obscured the increase in short-term rates that occurred throughout the year.

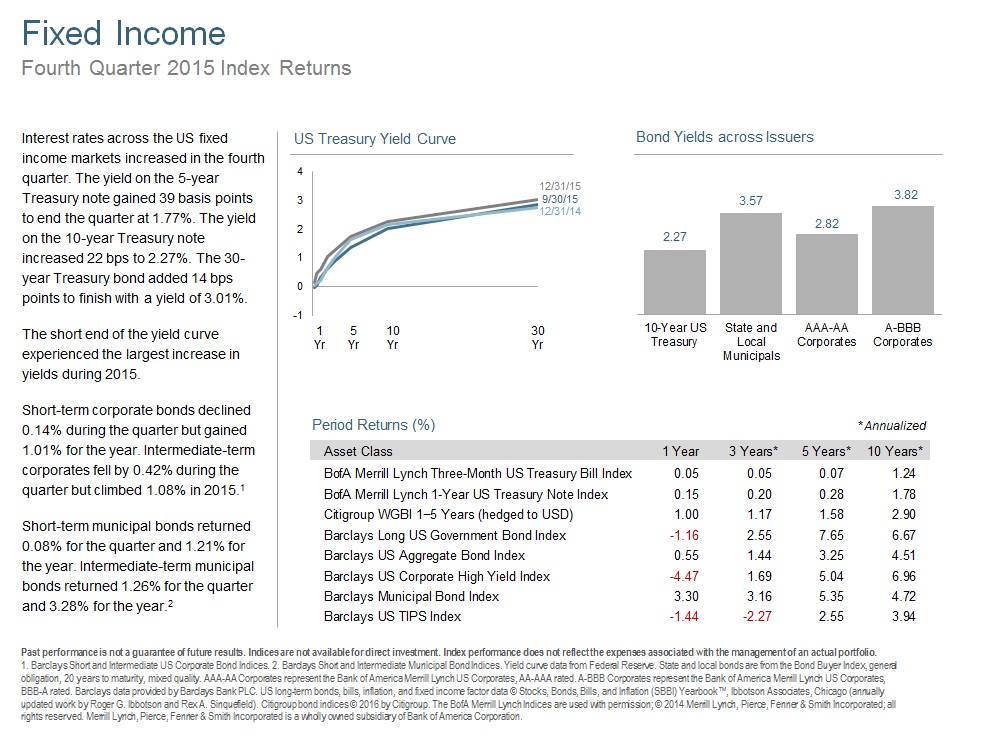
The yield on the 2-Year US Treasury note more than doubled in 2015, rising from 0.45% in January to 1.06% at year end[1].

The yield on the 1-Year US Treasury note more than quintupled, from 0.15% to .65% over the same period. The 6-Month US Treasury bill’s yield rose from a low of 0.03% in May to .49% on December 31. Yet, despite the higher rates, we have not experienced the corresponding financial storm that many predicted in the fixed income market.

The question of how far the Fed will go in raising its overnight target rate is still open. Similarly, we can ask ourselves a more complex question: Is the market leading the Fed or is the Fed leading the market?

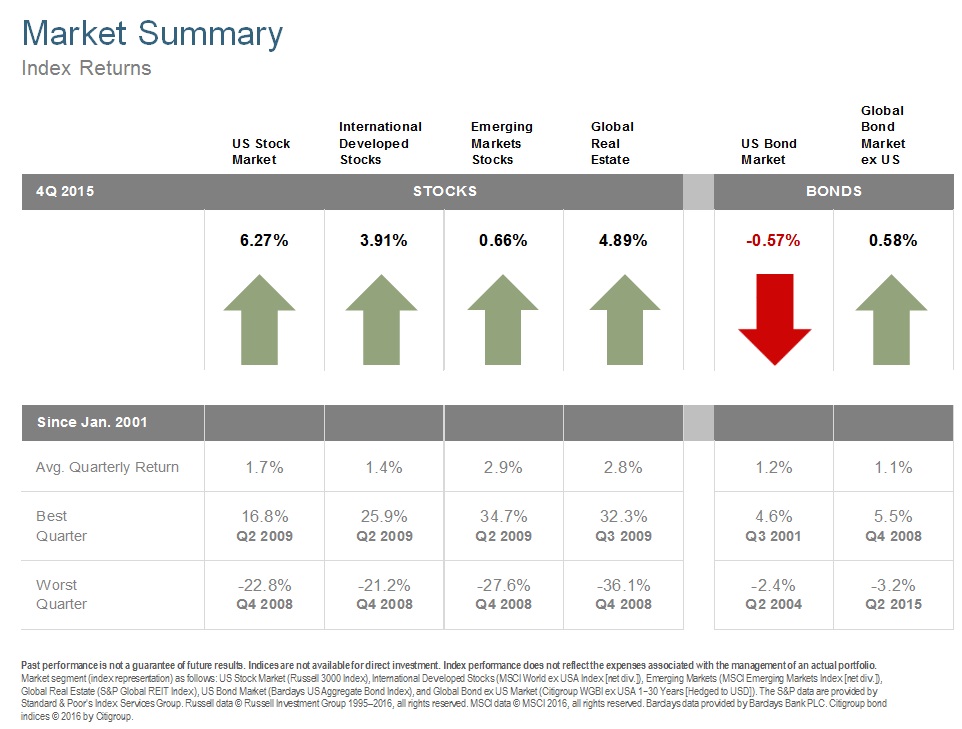
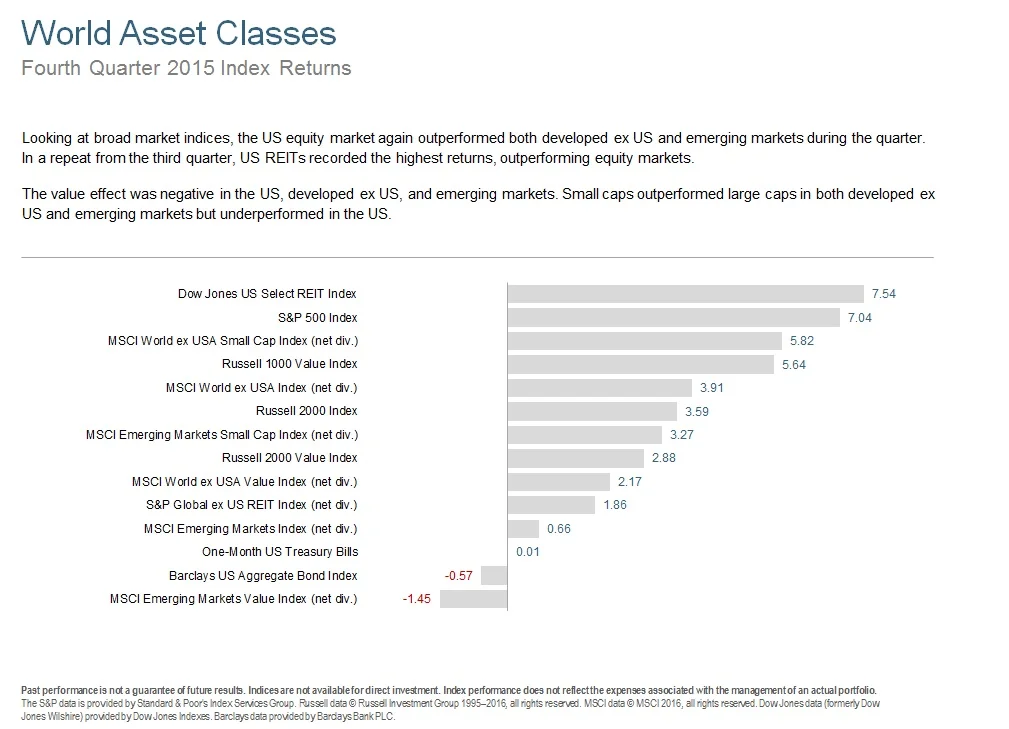
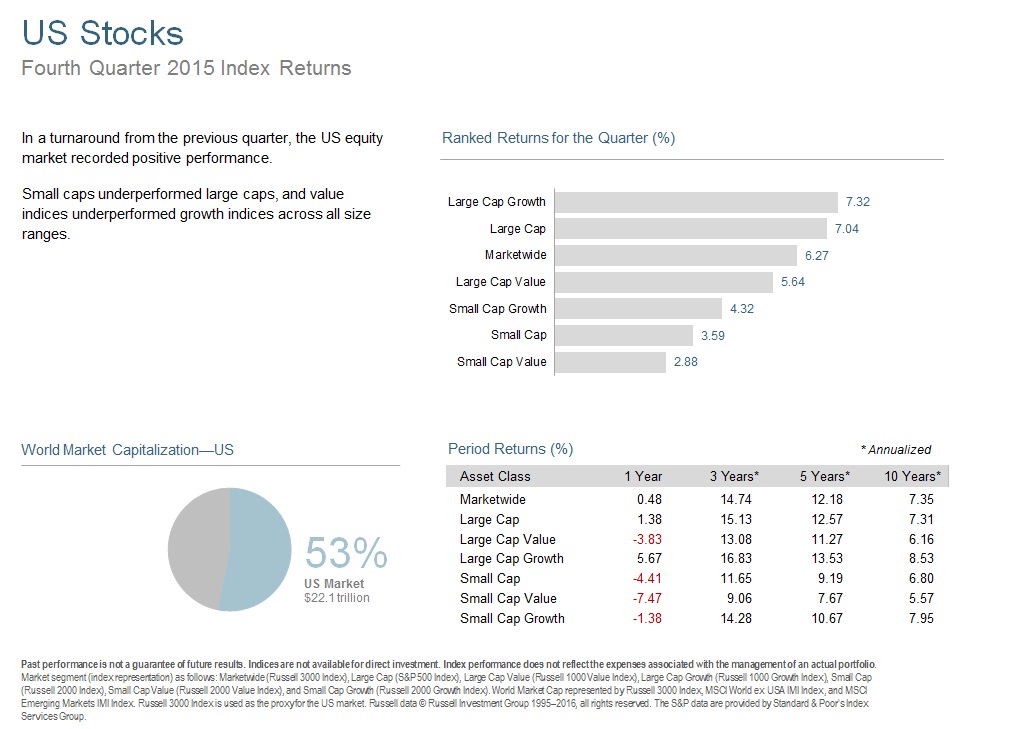
What we do know is that the economy is growing modestly and that inflation remains low in spite of improving labor markets, higher consumer spending, and record vehicle sales. The stock market seemed to acknowledge some of this good news by rallying in October, with the Russell 3000 Index up 6.27% for Q4.

In spite of the rebound, only the first month of the quarter was positive across our models at ATX Portfolio Advisors. The good news for our customers is that our Accountable pricing puts us in your shoes and we only charged advisory fees in the month of October.

Falling oil prices, the Chinese economy, terrorism, and rising interest rates are just some of the current bricks in the "wall of worry". If you are more worried than normal, it may be a good time to review your plan. Otherwise, have a Happy New Year while you scroll through the Q4 2015 Market Review.


[1]As of December 31, 2015. Source: www.treasury.gov
Fixed income securities are subject to increased loss of principal during periods of rising interest rates and may be subject to various other risks, including changes in credit quality, liquidity, prepayments, and other factors. Sector-specific investments can increase these risks.
All expressions of opinion are subject to change. This information is intended for educational purposes, and it is not to be construed as an offer, solicitation, recommendation, or endorsement of any particular security, products, or services. 

Q3 2015 Market Review

Time for Liftoff?

The volatility that began to show itself in Q2 increased in Q3, as we experienced the first 10% correction in US markets since 2011. All eyes have been on the Federal Reserve, as their decision to defer raising rates (a.k.a. "Liftoff") from essentially 0% due to global concerns centering on China has led to continuing worries about the ultimate impact on global growth.

At ATX Portfolio Advisors, September was the fourth consecutive month of negative returns across all of our models. Our Accountable pricing puts us in your shoes, as we have not charged any advisory fees as a result.

We all look forward to more profitable periods, and there is good news if you pay attention. The reason the Fed is considering raising rates is because of underlying strength in the US Economy. Through most of history, the first Fed move has proven to be a mid-cycle event. If that is the case, the recent volatility should be a good time to take advantage of the uncertainty being priced into the markets for long term investors.

The recent volatility is well within historical norms, and is the price of taking risk to achieve higher long term returns. If the price is too steep (i.e. loss of appetite, no sleep at night), we should review your personal situation and risk tolerance. That's what you pay me for, at least when the market goes up.

Market segment (index representation) as follows: US Stock Market (Russell 3000 Index), International Developed Stocks (MSCI World ex USA Index [net div.]), Emerging Markets (MSCI Emerging Markets Index [net div.]), Global Real Estate (S&P Globa…

Market segment (index representation) as follows: US Stock Market (Russell 3000 Index), International Developed Stocks (MSCI World ex USA Index [net div.]), Emerging Markets (MSCI Emerging Markets Index [net div.]), Global Real Estate (S&P Global REIT Index), US Bond Market (Barclays US Aggregate Bond Index), and Global Bond ex US Market (Citigroup WGBI ex USA 1−30 Years [Hedged to USD]). The S&P data are provided by Standard & Poor's Index Services Group. Russell data © Russell Investment Group 1995–2015, all rights reserved. MSCI data © MSCI 2015, all rights reserved. Barclays data provided by Barclays Bank PLC. Citigroup bond indices © 2014 by Citigroup. 

Graph Source: MSCI ACWI Index. MSCI data © MSCI 2015, all rights reserved.

Graph Source: MSCI ACWI Index. MSCI data © MSCI 2015, all rights reserved.

The S&P data is provided by Standard & Poor's Index Services Group. Russell data © Russell Investment Group 1995–2015, all rights reserved. MSCI data © MSCI 2015, all rights reserved. Dow Jones data (formerly Dow Jones Wilshire) provided by …

The S&P data is provided by Standard & Poor's Index Services Group. Russell data © Russell Investment Group 1995–2015, all rights reserved. MSCI data © MSCI 2015, all rights reserved. Dow Jones data (formerly Dow Jones Wilshire) provided by Dow Jones Indexes. Barclays data provided by Barclays Bank PLC. 

Market segment (index representation) as follows: Marketwide (Russell 3000 Index), Large Cap (S&P 500 Index), Large Cap Value (Russell 1000 Value Index), Large Cap Growth (Russell 1000 Growth Index), Small Cap (Russell 2000 Index), Small Cap Val…

Market segment (index representation) as follows: Marketwide (Russell 3000 Index), Large Cap (S&P 500 Index), Large Cap Value (Russell 1000 Value Index), Large Cap Growth (Russell 1000 Growth Index), Small Cap (Russell 2000 Index), Small Cap Value (Russell 2000 Value Index), and Small Cap Growth (Russell 2000 Growth Index). World Market Cap represented by Russell 3000 Index, MSCI World ex USA IMI Index, and MSCI Emerging Markets IMI Index. Russell 3000 Index is used as the proxy for the US market. Russell data © Russell Investment Group 1995–2015, all rights reserved. The S&P data are provided by Standard & Poor's Index Services Group. 

Market segment (index representation) as follows: Large Cap (MSCI World ex USA Index), Small Cap (MSCI World ex USA Small Cap Index), Value (MSCI World ex USA Value Index), and Growth (MSCI World ex USA Growth). All index returns are net of withhold…

Market segment (index representation) as follows: Large Cap (MSCI World ex USA Index), Small Cap (MSCI World ex USA Small Cap Index), Value (MSCI World ex USA Value Index), and Growth (MSCI World ex USA Growth). All index returns are net of withholding tax on dividends. World Market Cap represented by Russell 3000 Index, MSCI World ex USA IMI Index, and MSCI Emerging Markets IMI Index. MSCI World ex USA IMI Index used as the proxy for the International Developed market. MSCI data © MSCI 2015, all rights reserved. 

Market segment (index representation) as follows: Large Cap (MSCI Emerging Markets Index), Small Cap (MSCI Emerging Markets Small Cap Index), Value (MSCI Emerging Markets Value Index), and Growth (MSCI Emerging Markets Growth Index). All index retur…

Market segment (index representation) as follows: Large Cap (MSCI Emerging Markets Index), Small Cap (MSCI Emerging Markets Small Cap Index), Value (MSCI Emerging Markets Value Index), and Growth (MSCI Emerging Markets Growth Index). All index returns are net of withholding tax on dividends. World Market Cap represented by Russell 3000 Index, MSCI World ex USA IMI Index, and MSCI Emerging Markets IMI Index. MSCI Emerging Markets IMI Index used as the proxy for the emerging market portion of the market. MSCI data © MSCI 2015, all rights reserved. 

Country performance based on respective indices in the MSCI World ex US IMI Index (for developed markets), Russell 3000 Index (for US), and MSCI Emerging Markets IMI Index. All returns in USD and net of withholding tax on dividends. MSCI data © MSCI…

Country performance based on respective indices in the MSCI World ex US IMI Index (for developed markets), Russell 3000 Index (for US), and MSCI Emerging Markets IMI Index. All returns in USD and net of withholding tax on dividends. MSCI data © MSCI 2015, all rights reserved. Russell data © Russell Investment Group 1995–2015, all rights reserved. UAE and Qatar have been reclassified as emerging markets by MSCI, effective May 2014.

Number of REIT stocks and total value based on the two indices. All index returns are net of withholding tax on dividends. Total value of REIT stocks represented by Dow Jones US Select REIT Index and the S&P Global ex US REIT Index. Dow Jones US…

Number of REIT stocks and total value based on the two indices. All index returns are net of withholding tax on dividends. Total value of REIT stocks represented by Dow Jones US Select REIT Index and the S&P Global ex US REIT Index. Dow Jones US Select REIT Index used as proxy for the US market, and S&P Global ex US REIT Index used as proxy for the World ex US market. Dow Jones US Select REIT Index data provided by Dow Jones ©. S&P Global ex US REIT Index data provided by Standard and Poor’s Index Services Group © 2014. 

All index returns are net of withholding tax on dividends. Securities and commodities data provided by Bloomberg.

All index returns are net of withholding tax on dividends. Securities and commodities data provided by Bloomberg.

Yield curve data from Federal Reserve. State and local bonds are from the Bond Buyer Index, general obligation, 20 years to maturity, mixed quality. AAA-AA Corporates represent the Bank of America Merrill Lynch US Corporates, AA-AAA rated. A-BBB Cor…

Yield curve data from Federal Reserve. State and local bonds are from the Bond Buyer Index, general obligation, 20 years to maturity, mixed quality. AAA-AA Corporates represent the Bank of America Merrill Lynch US Corporates, AA-AAA rated. A-BBB Corporates represent the Bank of America Merrill Lynch US Corporates, BBB-A rated. Barclays data provided by Barclays Bank PLC. US long-term bonds, bills, inflation, and fixed income factor data
© Stocks, Bonds, Bills, and Inflation (SBBI) Yearbook™, Ibbotson Associates, Chicago (annually updated work by Roger G. Ibbotson and Rex A. Sinquefield). Citigroup bond indices © 2014 by Citigroup. The BofA Merrill Lynch Indices are used with permission; © 2014 Merrill Lynch, Pierce, Fenner & Smith Incorporated; all rights reserved. Merrill Lynch, Pierce, Fenner & Smith Incorporated is a wholly owned subsidiary of Bank of America Corporation.

Asset allocations and the hypothetical index portfolio returns are for illustrative purposes only and do not represent actual performance. Global Stocks represented by MSCI All Country World Index (gross div.) and Treasury Bills represented by US On…

Asset allocations and the hypothetical index portfolio returns are for illustrative purposes only and do not represent actual performance. Global Stocks represented by MSCI All Country World Index (gross div.) and Treasury Bills represented by US One-Month Treasury Bills. Globally diversified allocations rebalanced monthly, no withdrawals. Data © MSCI 2015, all rights reserved. Treasury bills © Stocks, Bonds, Bills, and Inflation Yearbook™, Ibbotson Associates, Chicago (annually updated work by Roger G. Ibbotson and Rex A. Sinquefield). 

Past performance is not a guarantee of future results. Indices are not available for direct investment. Index performance does not reflect the expenses associated with the management of an actual portfolio.