
By Jeff Weeks, CFP® | The Accountable Update | November 4, 2026
Election night has a way of making the future feel obvious by breakfast. One party has momentum. The other has a problem. Before the campaign signs come down, somebody is ready to explain exactly what it all means for your investments.
After last night’s Democratic wave, I would suggest keeping November 2016 in mind, with one important distinction. Trump’s 2016 victory was an upset. This year, a strong Democratic showing was broadly consistent with the direction of the late polling and forecasts. That difference matters when considering what either election means for your investments.
As of the morning of November 4, reporting from the Associated Press and Reuters shows Democrats winning control of both the House and Senate. The breadth of the gains, including victories in traditionally Republican territory, is a major political development. Individual races and final margins are still being resolved. [1, 2]
Those results deserve attention. They do not, by themselves, tell me whether a particular family should own more stocks, fewer bonds, or a different collection of mutual funds.
An expected result can still make history
Before Election Day, the final Silver Bulletin forecast favored Democrats in both chambers, with Democratic candidates leading its polling averages in the major Senate battlegrounds. Last night’s broad direction was therefore much less surprising than the dramatic headlines might suggest. Particular races and the size of the gains could still exceed expectations. [7]
My working assumption is that much of the expected shift toward Democratic control was already reflected in market prices before the votes were counted. That is an inference about how markets incorporate public information, not something we can measure precisely from a poll. Investors had access to the same polling, forecasts, and campaign developments as everyone else.
A politically significant result does not have to be a financial surprise. Markets can still react to the gap between expectations and the final outcome, to uncertainty being resolved, or to new implications for policy. But an outcome that largely confirms expectations gives me even less reason to make a wholesale portfolio change the next morning.
The second surprise in 2016
Ten years ago, Donald Trump’s victory caught many observers off guard. Republicans also retained the House and Senate, setting up unified Republican government. That last detail matters: 2016 brought unified control, while this year’s midterms point toward a Democratic Congress alongside a Republican president. These are different governing arrangements, not identical political events. [3]
The market reaction in 2016 is the part I find particularly useful. As Trump’s victory became increasingly likely, S&P 500 futures fell roughly 5% overnight and reached their trading limit. By the close of regular trading on November 9, the S&P 500 cash index had gained about 1.1%. [4, 5]
An investor could have anticipated the election correctly and still made the wrong investment decision. An investor reacting to the overnight decline could have been surprised again before the next evening’s news. Getting the political story right did not settle the market story.
The longer view is useful, too. The accompanying Dimensional chart shows positive S&P 500 returns in both 2016 and 2017. But 2016’s bar covers the entire calendar year, including more than ten months before Election Day. It would be misleading to attribute that full year’s return to an election held in November. [6]
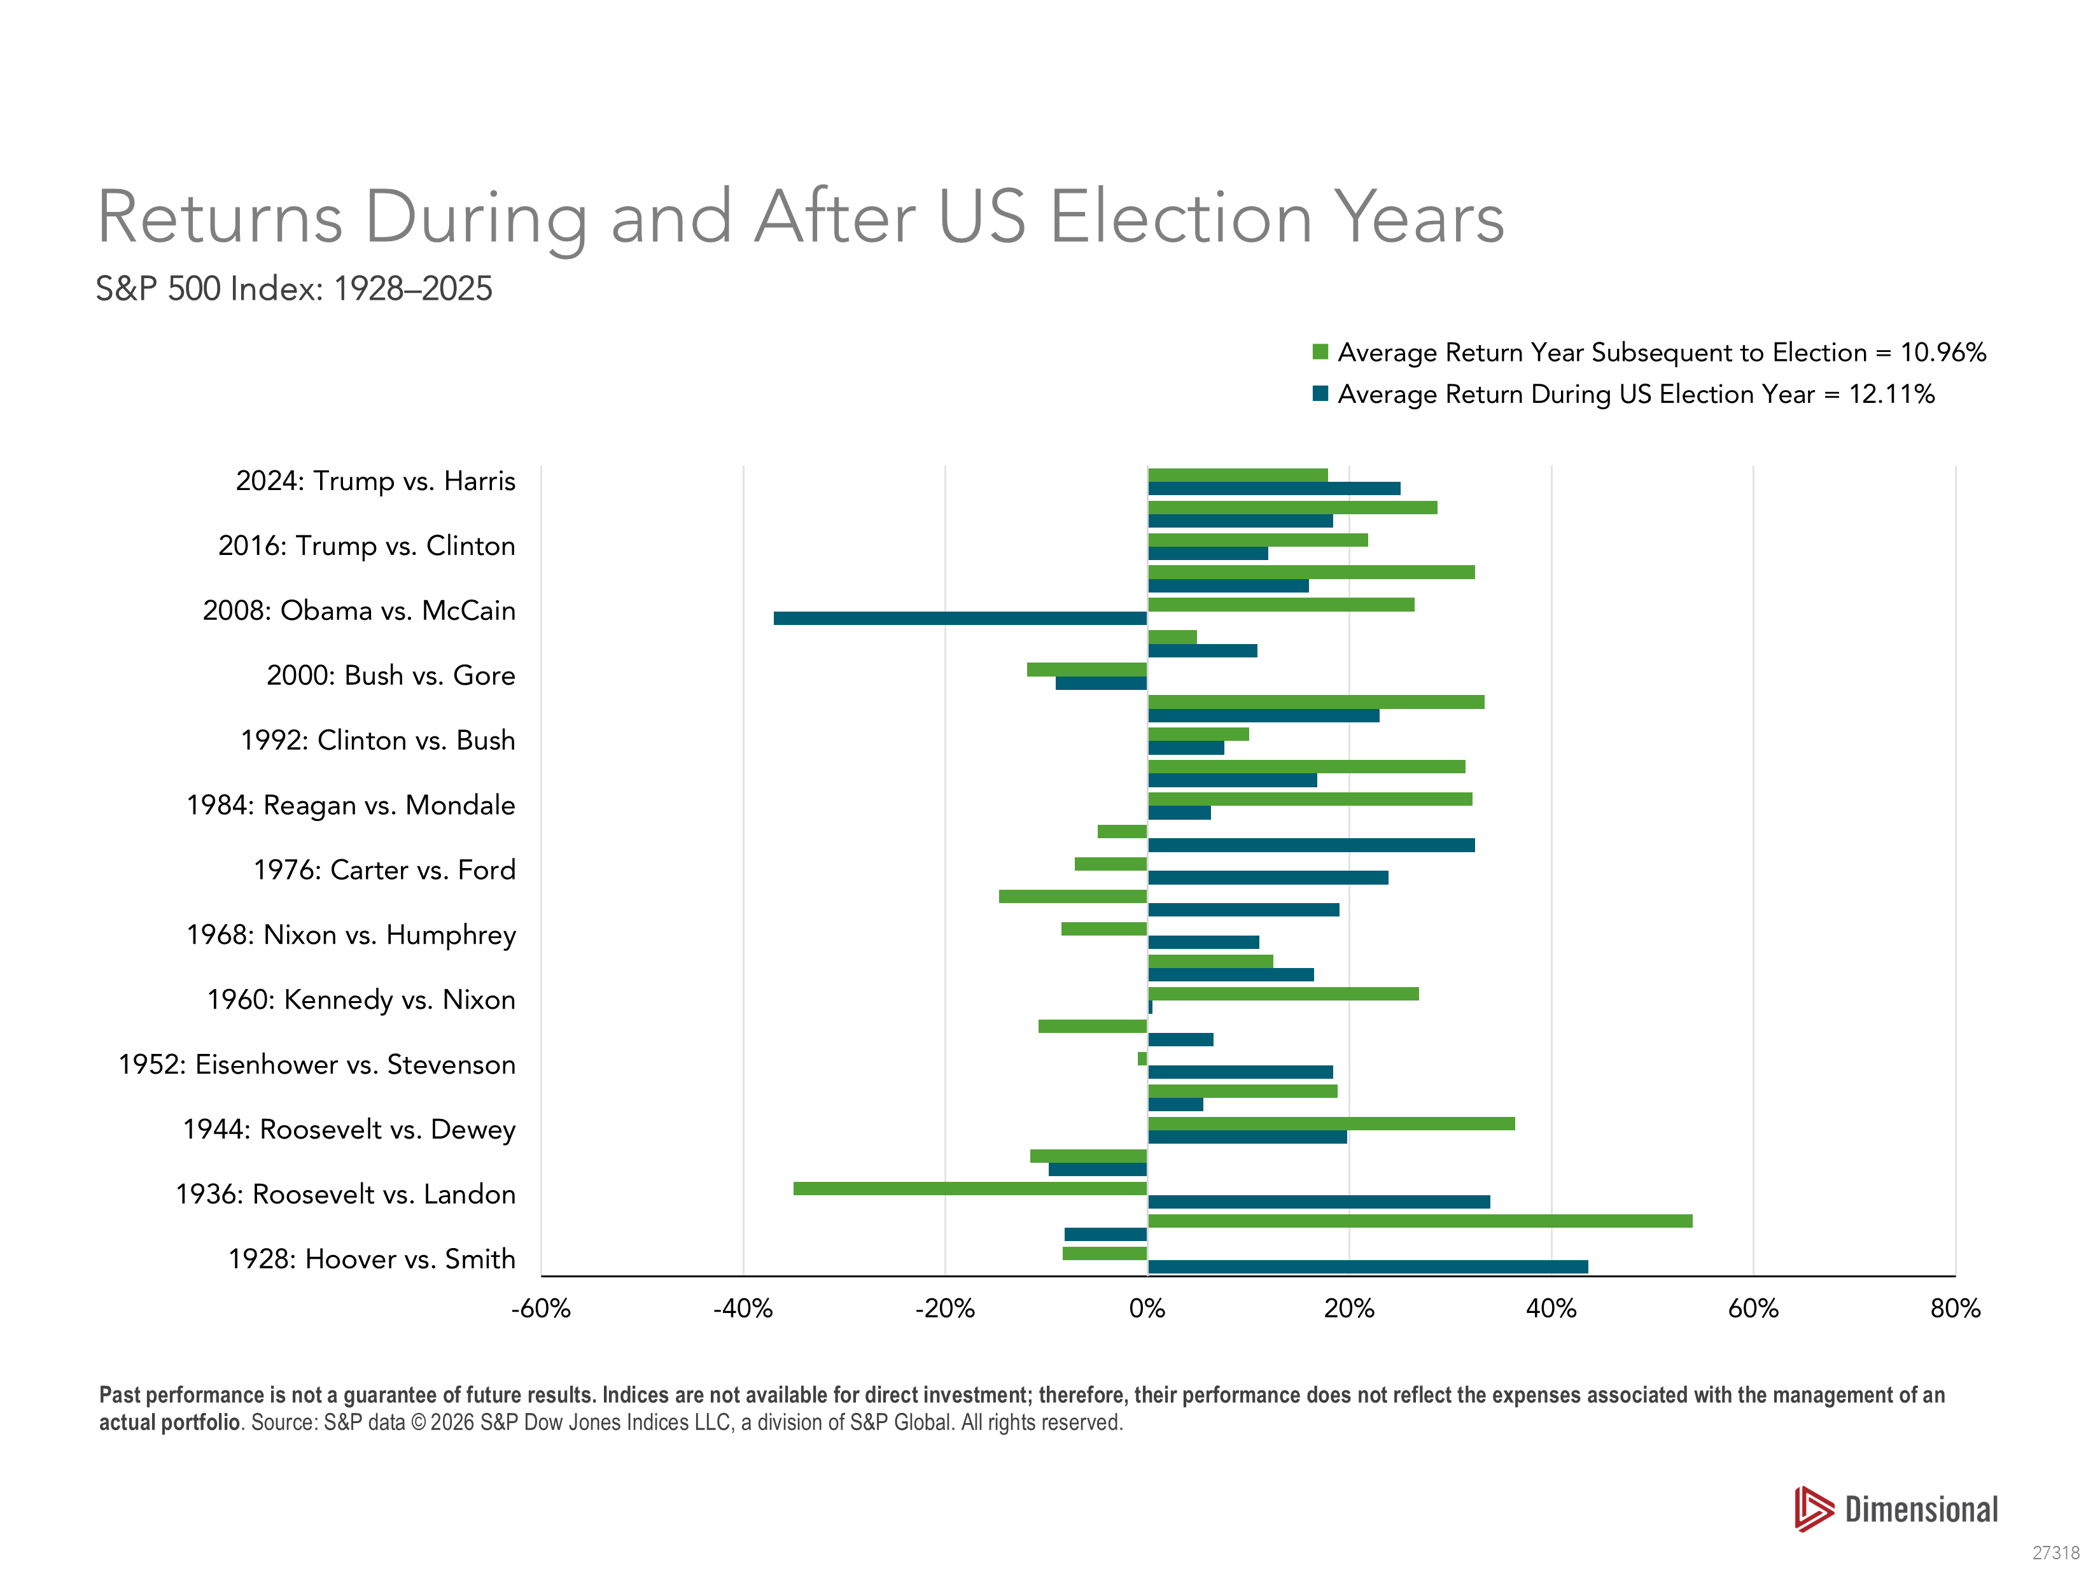
Figure 1. Presidential election years and the following calendar years. The range of outcomes is more informative than the average. This exhibit covers presidential elections, not midterms; it does not forecast returns after the 2026 election. Source: Dimensional, supplied presentation, slide 5. S&P 500 data through December 2025. Original source notes and disclosures retained.
What a political forecast leaves out
Turning an election opinion into a successful trade requires several judgments. You have to anticipate who wins, what policies actually follow, how those policies affect businesses, and how much of that outcome investors have already incorporated into prices. You also have to decide when to buy or sell. Each step introduces another opportunity to be wrong.
Even an apparently sensible conclusion can run into a price problem. A policy might improve a company’s prospects, but investors may already have paid generously for that improvement. Another company might face a less favorable environment while its share price already reflects considerable pessimism. A good political narrative does not tell us whether an investment is attractively priced.
That is why I am cautious about the inevitable lists of sectors to buy after an election. Businesses respond to customers, competitors, financing costs, technology, and events around the world, as well as government policy. An election changes some of those inputs. It does not give us advance notice of everything else that will happen.
Congress changes hands and businesses keep operating
The second chart is especially relevant to this morning’s discussion because it tracks party control of Congress. Over the period shown, the hypothetical growth of a dollar invested in the S&P 500 spans Republican control, Democratic control, and periods when the chambers were divided. Long-term market growth did not depend on one party maintaining power. [6]
I would not use that chart to declare which party is better for stocks. It does not isolate the effects of legislation from interest rates, valuations, earnings, wars, recessions, or technological advances. It also includes severe declines. What it does provide is perspective for anyone tempted to believe that owning productive businesses only makes sense when their preferred party controls Washington.
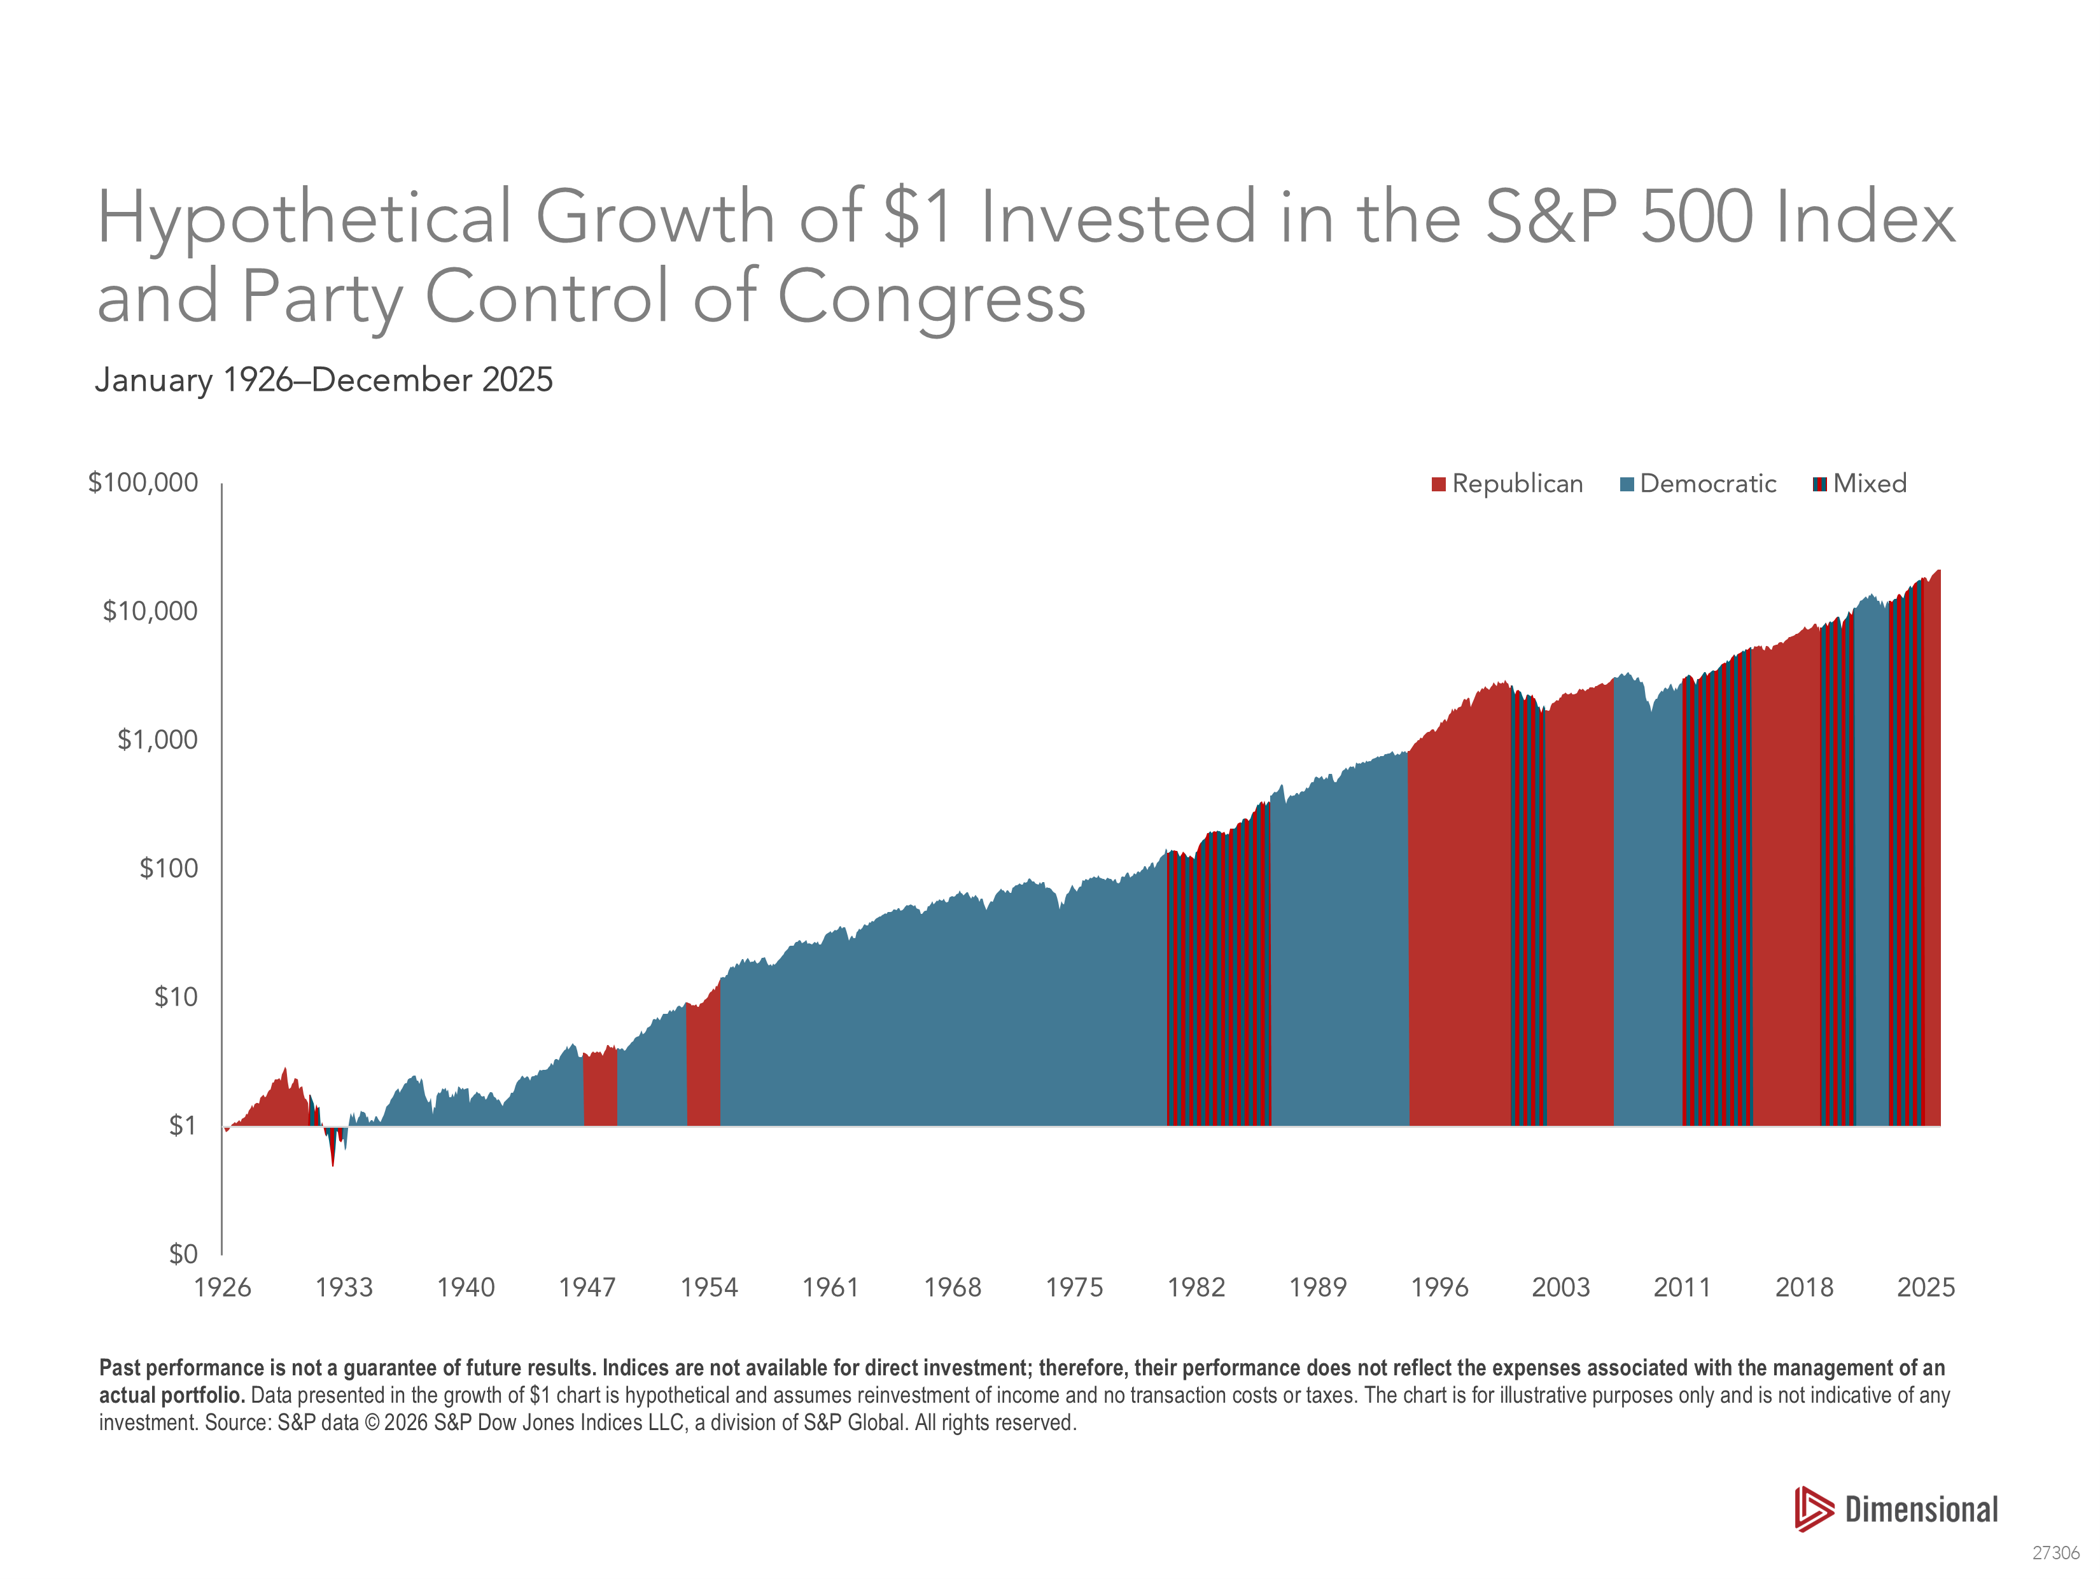
Figure 2. Hypothetical growth of $1 in the S&P 500, colored by party control of Congress, January 1926–December 2025. The vertical axis uses a logarithmic scale. The illustration assumes reinvestment of income and excludes transaction costs and taxes; index results do not reflect actual portfolio management expenses. It shows historical association, not the causal effect of either party. Source: Dimensional, supplied presentation, slide 11. Original source notes and disclosures retained.
A commitment to markets and evidence
At ATX Portfolio Advisors, I believe in markets and evidence. Market prices bring together the judgments of many investors responding to new information. There will be winners and losers as political winds change, but our commitment to markets working and to an evidence-based investment process remains unchanged.
That includes emphasizing value, smaller companies, and higher profitability within diversified portfolios. These approaches are grounded in decades of research into differences in expected returns. They do not depend on speculating about who will win an election, which campaign promises will become law, or which industry will receive favorable treatment. [9]
None guarantees outperformance, and each can experience extended periods of disappointing results. Patience and risk management still matter. But the rationale for these portfolio choices does not change simply because control of Congress does.
What I would review this morning
As an Austin financial planner, I am more interested in how a household’s portfolio supports its spending and retirement goals than in whether its holdings match the latest electoral map. An election can be a useful prompt to review a plan. The decision should still come back to the family’s circumstances.
Check near-term spending needs. Money needed soon should be held in investments suited to that time horizon. That was true before the votes were counted.
Review the allocation. If market movements have pushed stocks or bonds outside the intended range, consider rebalancing under the existing plan, with attention to taxes and trading costs.
Examine concentrated positions. Employer stock or a large sector exposure deserves scrutiny based on its effect on the household’s finances, regardless of which candidates won.
Respond to actual policy changes. A campaign proposal, an election victory, and an enacted law are different stages. Planning decisions should reflect what becomes law, when it takes effect, and whom it affects.
If your income, retirement date, spending needs, or ability to tolerate losses has changed, your portfolio may need attention. If the only change is how you feel about Washington this morning, I would slow down before placing a trade.
The same discipline applies when your candidates win. Relief and enthusiasm can encourage an investor to take more risk just as easily as disappointment can encourage a retreat to cash. I want an investment process that holds up through both reactions.
Last night changed the political landscape. We will learn more about the policy consequences in the months ahead. In the meantime, I would keep investment decisions tied to a diversified portfolio, realistic spending needs, and a plan that allows for surprises.
If you would like to review whether your portfolio still fits your financial plan, get in touch through the ATX Portfolio Advisors contact page. I am happy to help you think it through.
Past performance does not guarantee future results. Investing involves risk, including loss of principal. Diversification does not guarantee a profit or prevent a loss. Indexes are not available for direct investment. This article is general educational information; individual planning decisions depend on your circumstances.
1. Associated Press — 2026 election results 2. Reuters — Democrats win Congress, November 4, 2026 4. BBC — 2016 presidential and congressional results 5. Reuters — Overnight futures decline, November 9, 2016 6. Reuters — Stocks reverse course, November 9, 2016 7. Dimensional, Market Returns During Election Years, supplied PowerPoint: slides 5 and 11. Original chart source notes and disclosures retained. 8. Silver Bulletin — Final November 3, 2026 forecast 9. Decision Desk HQ — November 3, 2026 forecast 10. Dimensional — Market prices and size value profitability research