

In early 2016, I was watching one of the cable business channels when a guest predicted that the stock market would crash on a particular day the following month. He even narrowed it down to what time of day the crash would occur.
After discussing last week how different folks can arrive at very different conclusions when viewing the same data or charts, I was reminded of this article I wrote for the Accountable Update last year. The original, 4 Letters Worth Repeating, T-I-M-E, was good enough that I find it worth repeating, again. I did fix some questionable syntax and updated the charts with data through 2016.
The article may be easier to read on ATXAdvisors.com than the email version due to the way some of the slides are formatted. Enjoy between the fireworks and BBQ this weekend and have a safe and Happy Independence Day!
4 Letters Worth Repeating
This week, there was a story on a major "financial" network that predicted not only that the US stock market would peak on a particular day in March, but that it would happen after lunch. Appropriately, that network refers to itself with a 4-letter word.
But really, how considerate of them? With that level of detail, we should all be able to ride our unicorns down to Wall Street after sleeping late and enjoying a nice brunch, with time to spare to put in our sell orders before the bottom falls out.
I can think of a couple of 4-letter words for that kind of "news".
John Maynard Keynes is credited with uttering, “The market can stay irrational longer than you can stay solvent.” The famous (or infamous to some) economist made that observation after he had lost most of his money in ill-timed currency trades using borrowed money in early 1920. He was supposedly betting against the German Deutschmark as Deutschland struggled to recover after The Great War. Of course, in hindsight, he was right to see the black clouds building over the Weimer Republic that ultimately ended in hyperinflation and the rise of the National Socialist German Workers' Party (also known as the Nazis).
It turns out he was right about everything but, WHEN.
Decades later, investing legend Peter Lynch observed, "Far more money has been lost by investors preparing for corrections, or trying to anticipate corrections, than has been lost in corrections themselves." I suppose, though, that practical advice is much less likely to keep you glued to your TV set.
The reason it is so hard to know in the short run how any asset may perform is that the market reflects the aggregate expectations of all market participants, all the time. Folks that are willing to buy an asset are competing with folks who want to sell. When they agree on a price, they both feel that they are making the best deal. The buyer anticipating the asset will increase in price faster than other investment alternatives, the seller that the money will be more effectively invested elsewhere.
At ATX Portfolio Advisors, we believe that while the market incorporates all available information to drive stocks to fair value, we also believe that stocks may have different expected returns. In other words, there are certain characteristics that have resulted in returns that are greater than average that have persisted over time and across markets.
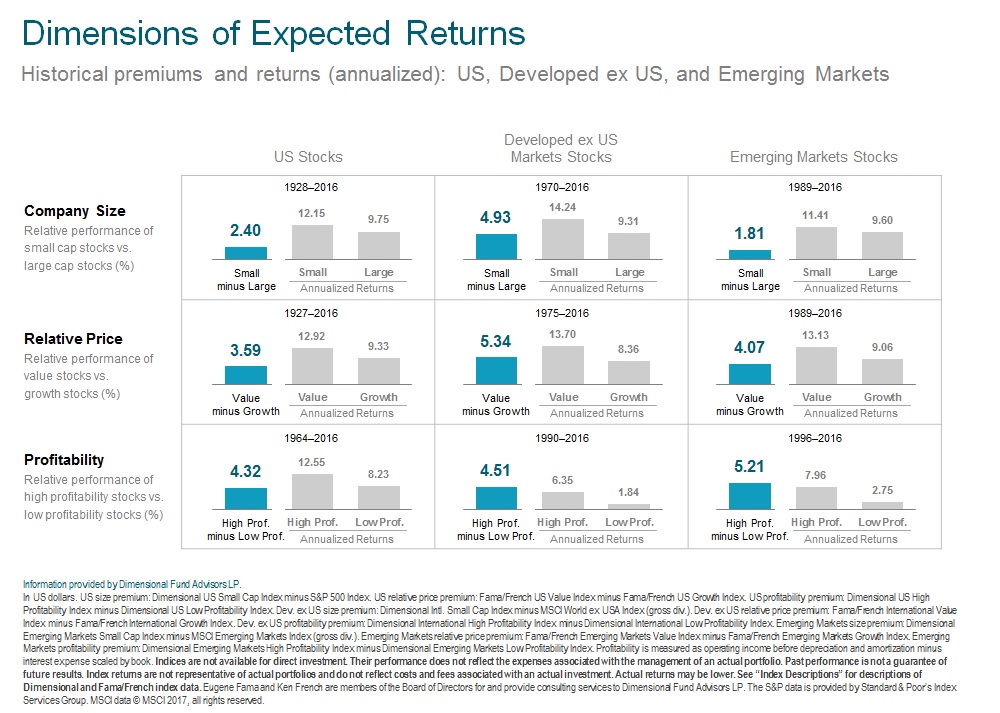
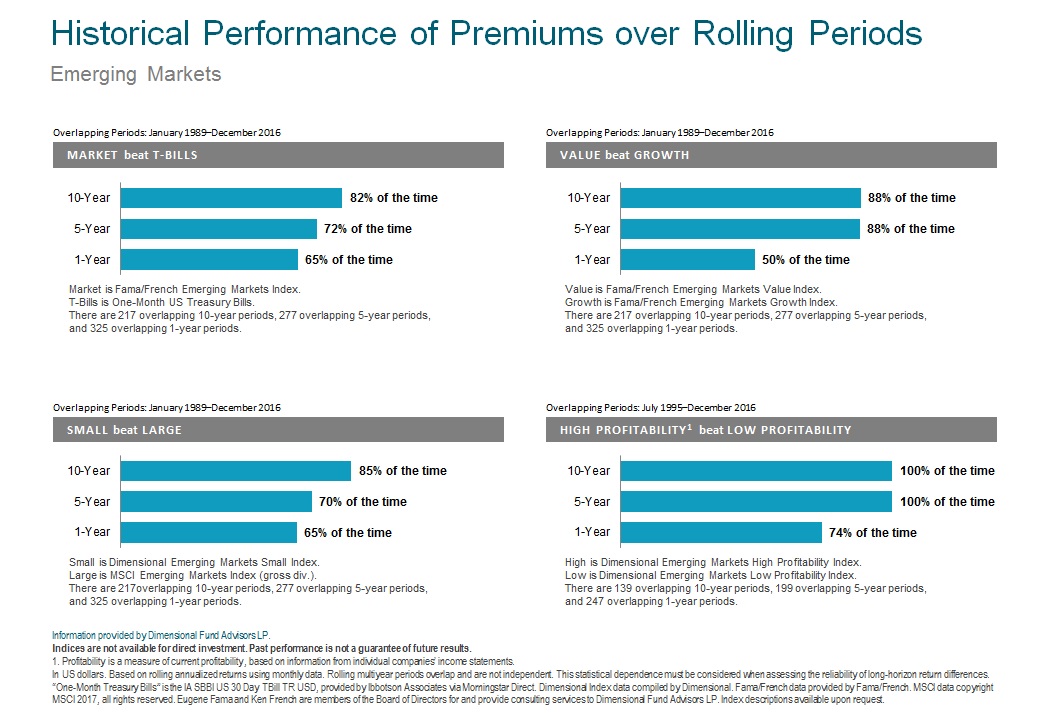
For stocks, there are four characteristics, or dimensions, that compelling evidence shows persistently over time. First is the market itself—stocks have higher expected returns than T-bills. Other characteristics include—company size (small vs. large), relative price (value vs. growth), and profitability (high vs. low).
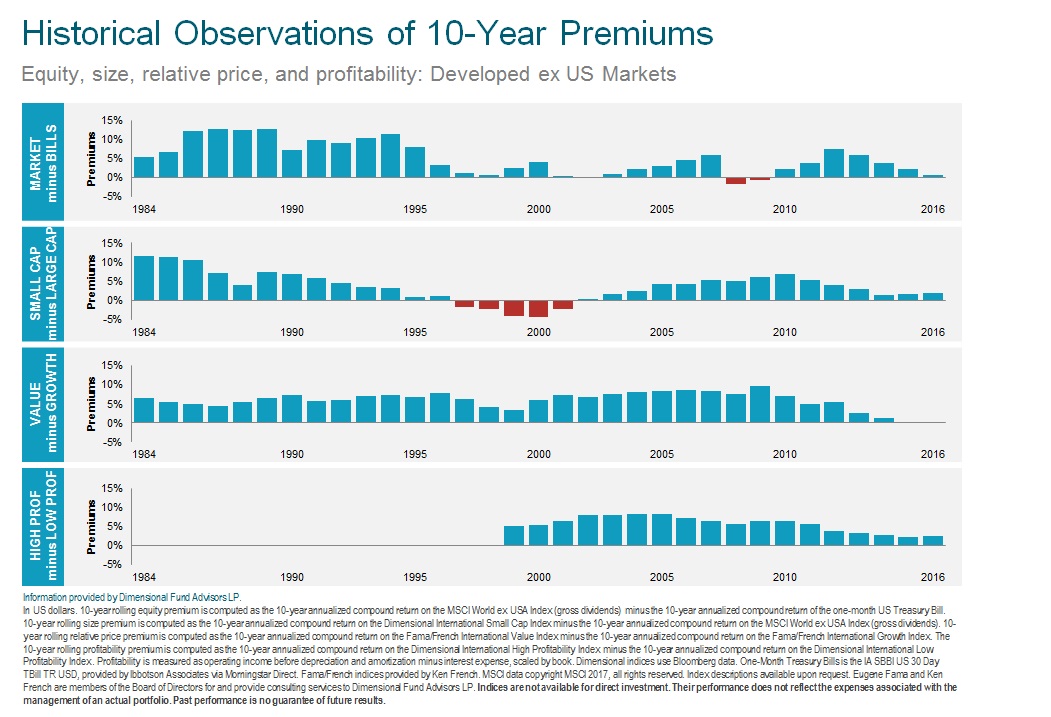
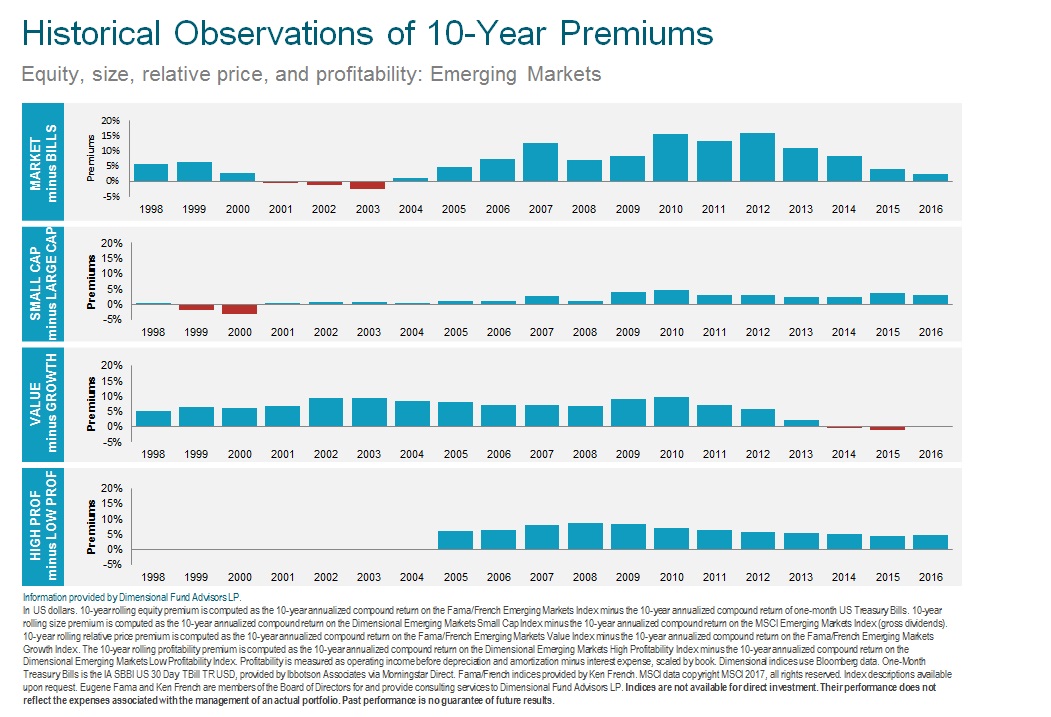
The chart below documents the historical premiums that the size, relative price, and profitability dimensions have produced over time frames that reliable data is available. As you can see, the premiums have persisted over long time frames across different types of markets.
The next set of charts show the yearly relative performance of dimensions in US, Developed International, and Emerging Markets stocks. The blue bars indicate years in which the market, small cap, value, and profitability premiums were positive. The red bars indicate years in which the premiums were negative. A positive premium indicates out-performance (e.g., small cap stocks outperform large cap stocks); a negative premium indicates under-performance (e.g., small cap stocks under-perform large cap stocks).
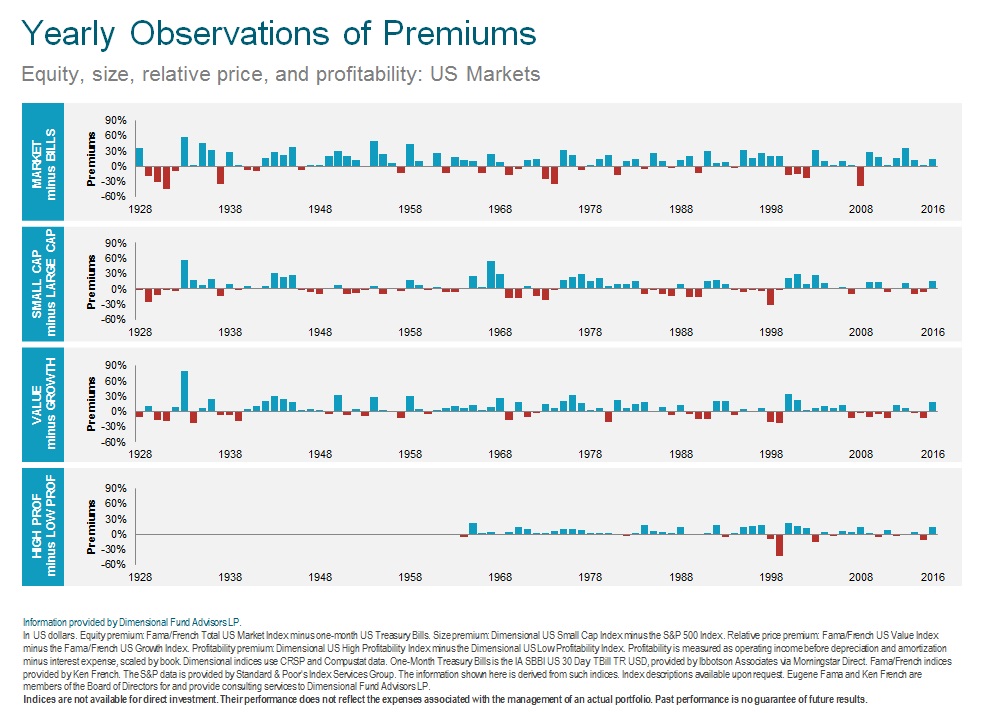
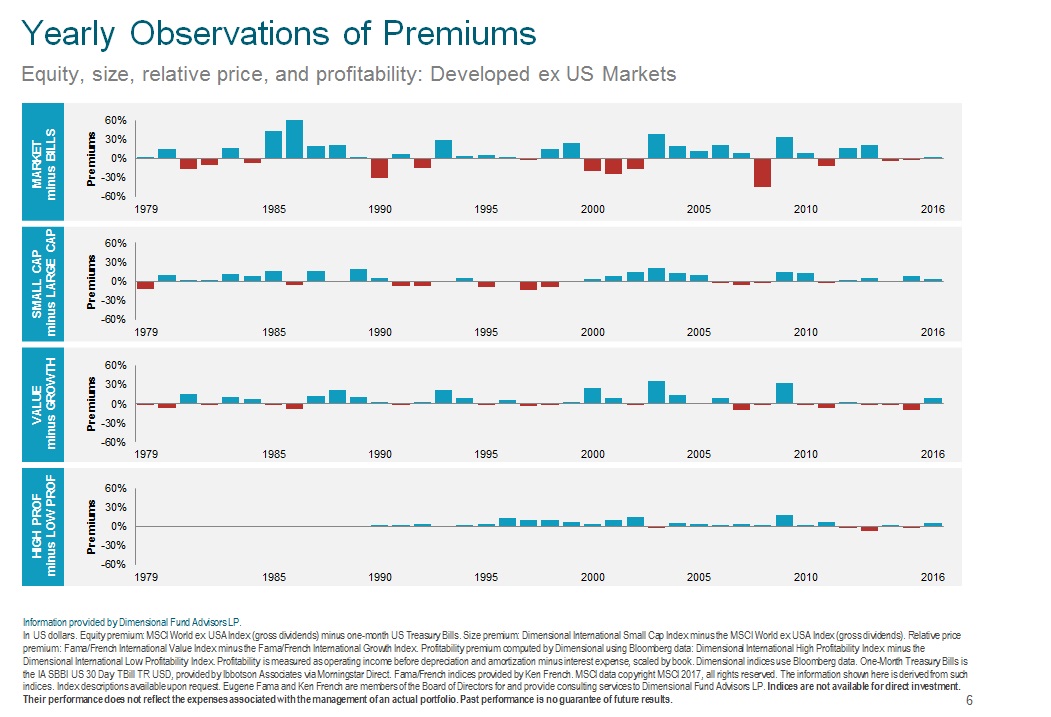
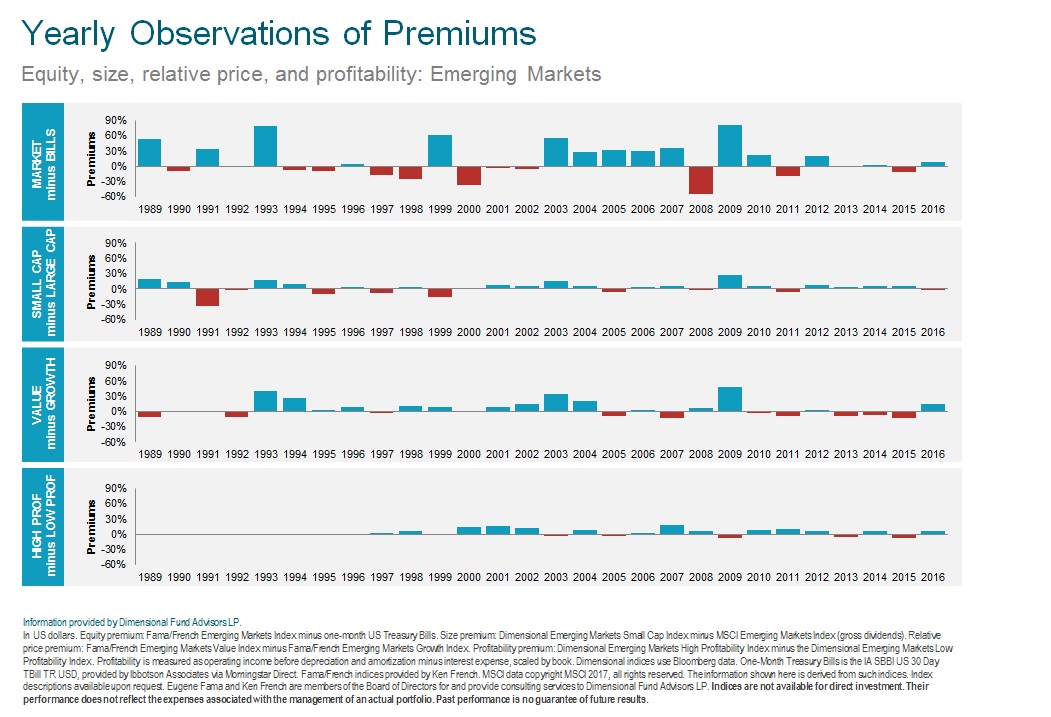
Over these periods, positive premiums have occurred more frequently than negative premiums across all dimensions. BUT, the premiums can and do vary widely from year to year and can experience extreme and prolonged negative relative performance. In other words, there is no free brunch.
This is why we say you should take a longer-term view and stay disciplined during periods of volatility or under-performance of any premium. Over longer periods however, we have observed a higher frequency of positive premiums.
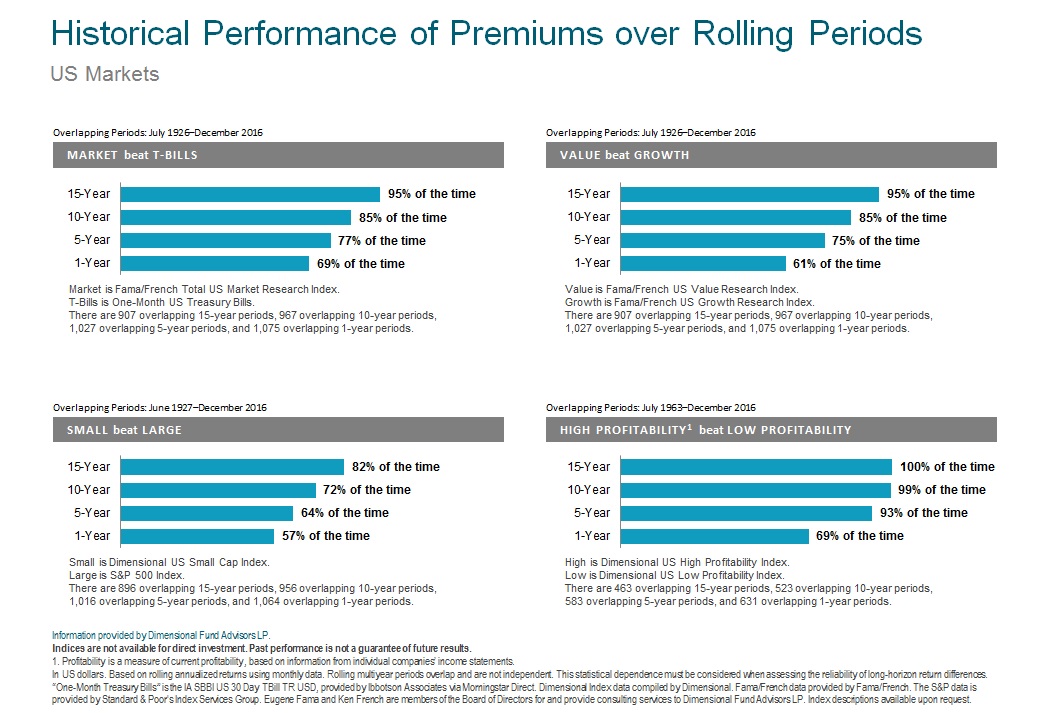
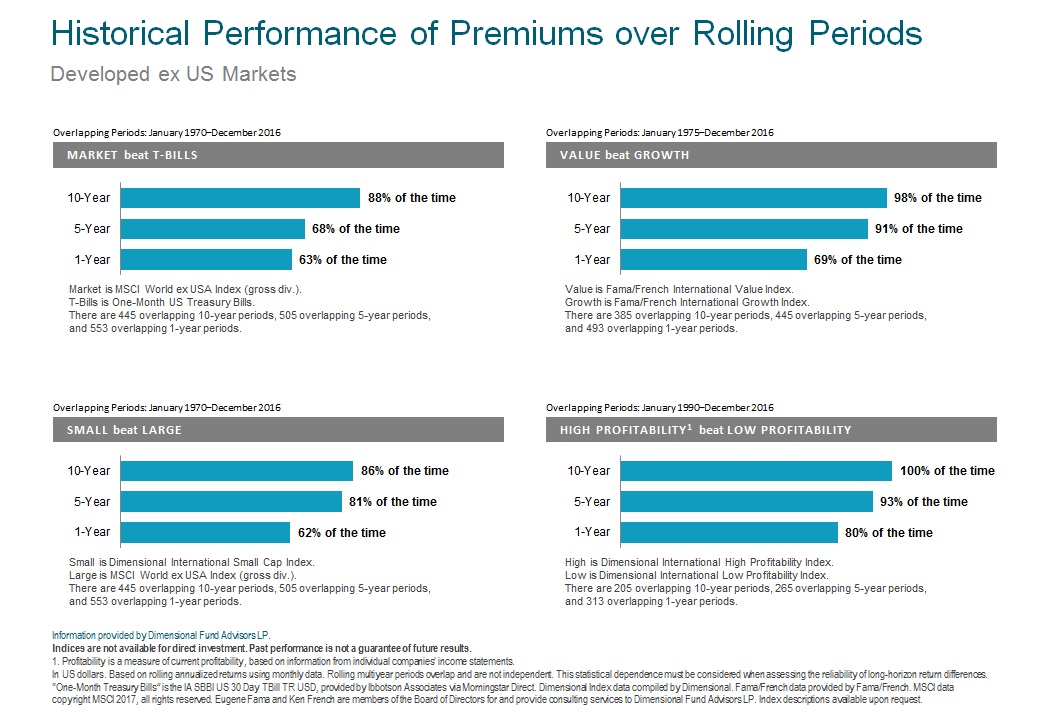
This next set documents the relative 5-year annualized performance of return dimensions in the different markets. When looking at longer time spans, observations of premiums are more consistent compared to one observation in any given year.
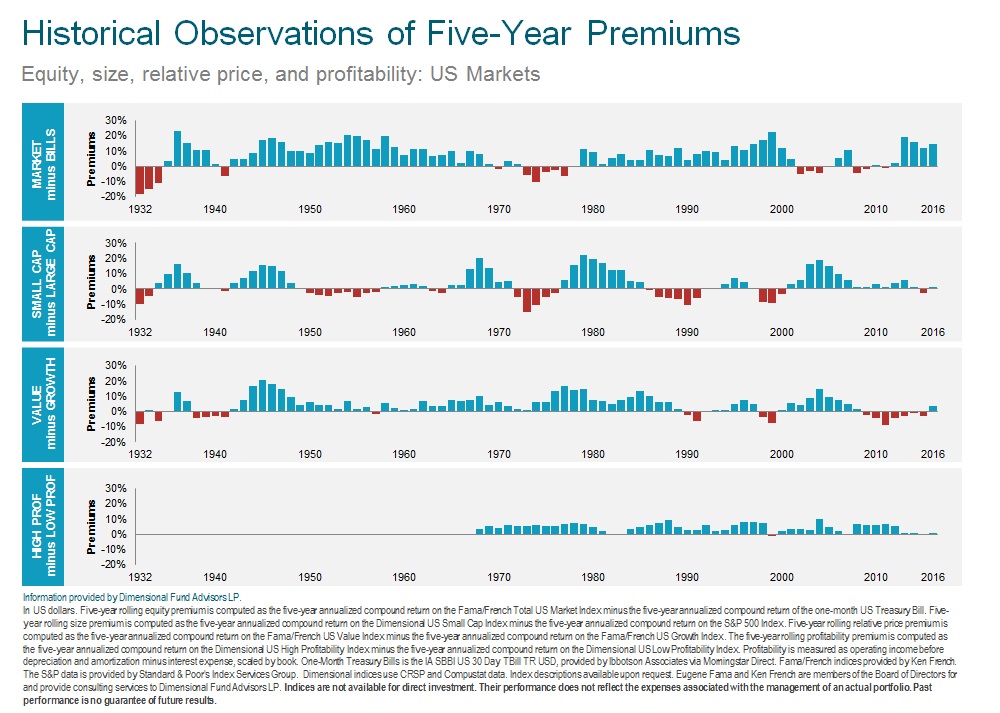
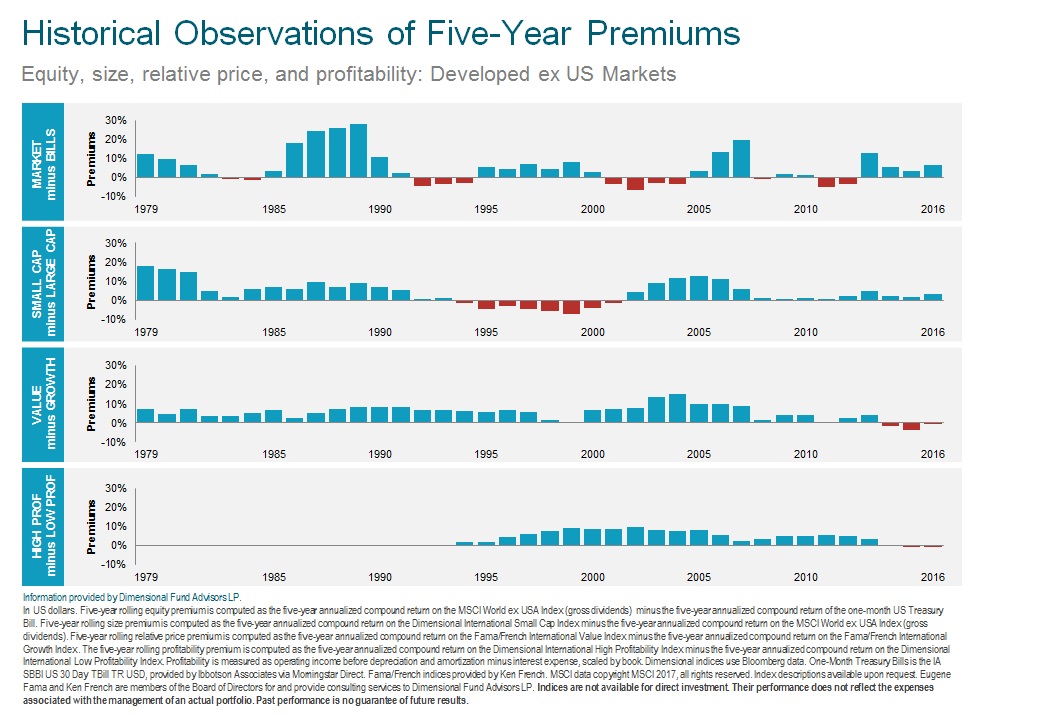
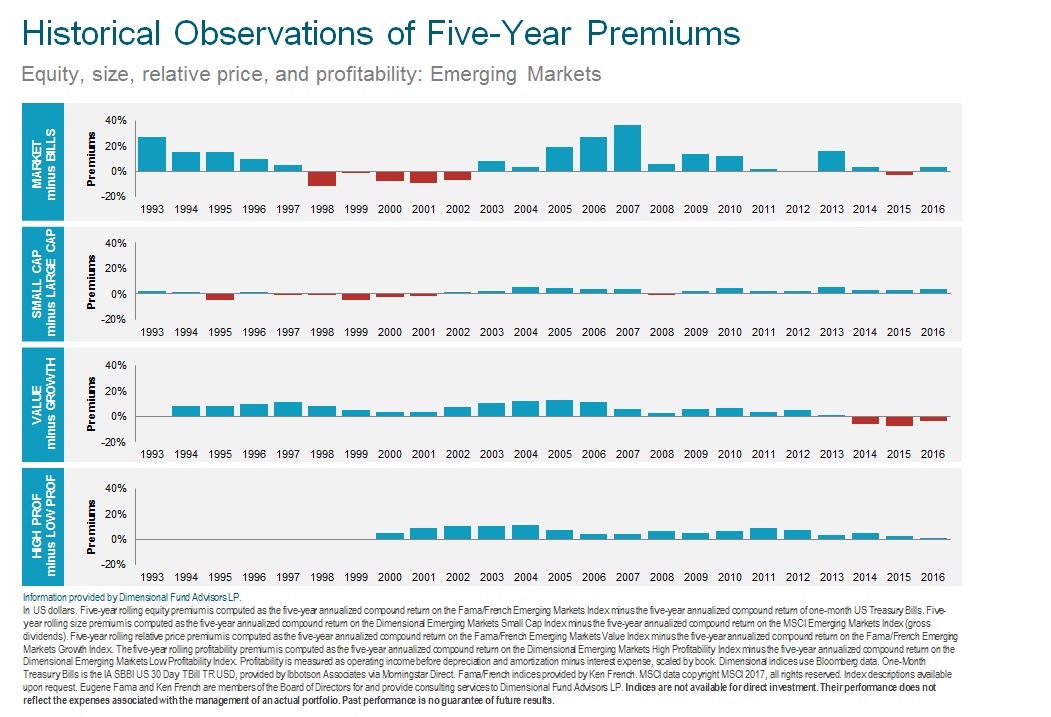
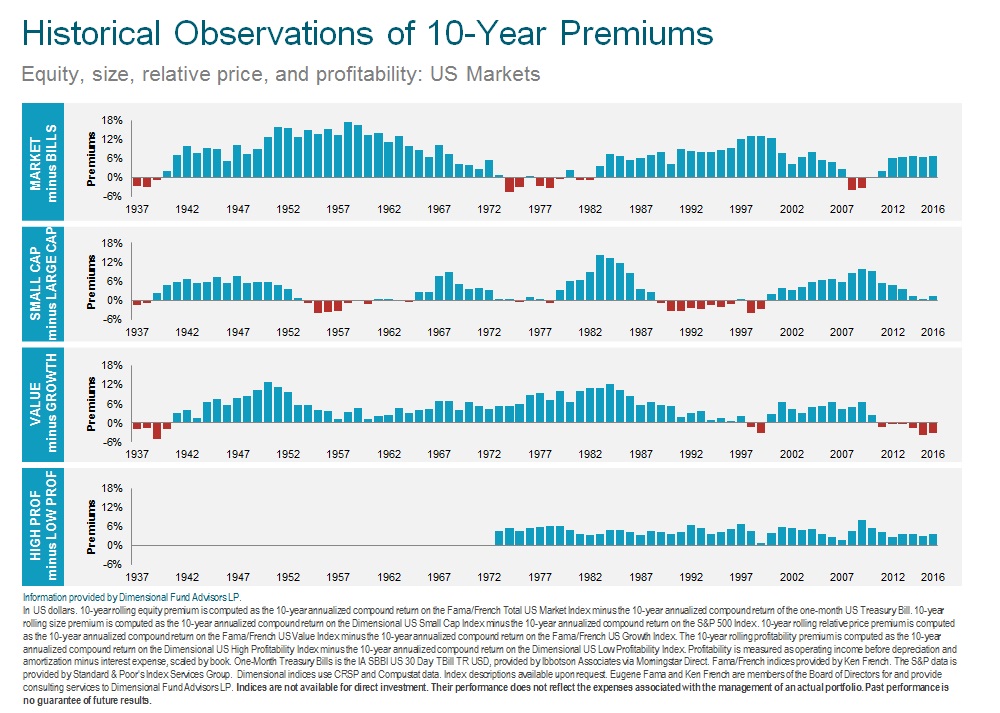
As you can see, there are fewer negative (red bars) 5-year periods versus positive (blue bars) periods. The difference is even more pronounced in historical observations of 10-year premiums as illustrated below.
Please remember that despite the higher frequency of positive premiums, outperformance may not be consistent, even over longer periods of time. Long-term investors should consider that premiums are never guaranteed and can undergo periods of negative returns in both relative and absolute terms.
All we have to do is look at the last 10-year period to remind ourselves of these facts, as many of the premiums have been smaller than historical averages.

If the first several slides show why we stick to our strategy of owning the total market with weightings tilted to those dimensions that have demonstrated historical premiums, it is the last set that illustrates why our philosophy isn't likely to change when short term divergences from historical averages occur. They clearly show that the longer our investment period was, the more likely we were to see a premium in all of the dimensions. That's not nearly as exciting as screaming about market tops or bottoms, but it is pretty compelling evidence to stay the course no matter how loud the carnival barker chorus.
If nothing else, all of this reminds us of the old adage, “Time in the market is more important than timing the market.” T-I-M-E, now that's a 4-letter word worth worth repeating.
If you or someone you know lacks the time to plan and manage your portfolio, let's get acquainted.
Index descriptions available here.