3 Ways to Avoid 9 Mistakes

man-person-street-shoes.jpg

Yesterday, the Dow Jones Industrial Average fell 1.2%, the S&P 500 shed 1.5%, and the Nasdaq Composite dropped 1.9%. It marked the end of a 63-day stretch where volatility has been remarkably absent. In fact, the last time we saw a streak of trading days with fewer 1% moves in either direction was in 1995.

Whether this is the start of a new period of increased volatility, or just a temporary blip on the screen, the tendency can be to react. That’s why it can be helpful to also study the history of mistakes that investors tend to make and the lessons we have learned.

Back in 2010, the Library of Congress’s Federal Research Division prepared a report titled Behavioral Patterns and Pitfalls of US Investors. The report identified common investment mistakes as cited by academics and professionals across several fields including business, economics, finance, psychology, and sociology.

The report identified nine common mistakes, which were also used as the basis for an Investor Bulletin from the SEC in 2014. The good news is that I think you can avoid making all nine of these mistakes in three relatively easy ways.

First, let's look at the mistakes.

The Mistakes

  1. Active Trading:  An investor using an active trading investment strategy engages in regular, ongoing buying and selling of investments.  This kind of investor purchases investments and continuously monitors their activities in order to take advantage of profitable conditions in the market.  The Report concludes that active trading generally results in the underperformance of an investor’s portfolio.
  2. Disposition Effect:  The disposition effect is the tendency of an investor to hold on to losing investments too long and sell winning investments too soon.  In the months following the sale of winning investments, these investments often continue to outperform the losing investments still held in the investor’s portfolio.
  3. Focusing on Past Performance of Mutual Funds and Ignoring Fees:  When deciding to purchase shares in a mutual fund, the Report indicates that some investors focus primarily on the mutual fund’s past annualized returns and tend to disregard the fund’s expense ratios, transaction costs, and load fees, despite the harm these costs and fees can do to their investment returns.
  4. Familiarity Bias:  Familiarity bias refers to the tendency of an investor to favor investments from the investor’s own country, region, state or company.  Familiarity bias also includes an investor’s preference for “glamour investments;” that is, well-known and/or popular investments.  Familiarity bias may cause an investor’s portfolio to be inadequately diversified, which can increase the portfolio’s risk exposure.
  5. Manias and Panics:  Financial “mania” or a “bubble” is the rapid rise in the price of an investment, reflecting a high degree of collective enthusiasm or exuberance regarding the investment’s prospects.  This rapid rise is usually followed by a contraction in the investment’s price.  The contraction, or “panic” occurs when there is wide-scale selling of the investment that causes a sharp decline in the investment’s price.
  6. Momentum Investing:  An investor using a momentum investing strategy seeks to capitalize on the continuance of existing trends in the market.  A momentum investor believes that large increases in the price of an investment will be followed by additional gains and vice versa for declining values.
  7. Naïve Diversification:  Naïve diversification occurs when an investor, given a number of investment options, chooses to invest equally in all of these options.  While this strategy may not necessarily result in diminished performance, it may increase the risk exposure of an investor’s portfolio depending upon the risk level of each investment option.
  8. Noise Trading:  Noise trading occurs when an investor makes a decision to buy or sell an investment without the use of fundamental data (that is, economic, financial, and other qualitative or quantitative data that can affect the value of the investment).  Noise traders generally have poor timing, follow trends, and overreact to good and bad news in the market.
  9. Inadequate Diversification:  Inadequate diversification occurs when an investor’s portfolio is too concentrated in a particular type of investment.  Inadequate diversification increases the risk exposure of an investor’s portfolio.

Three Ways to Avoid Them

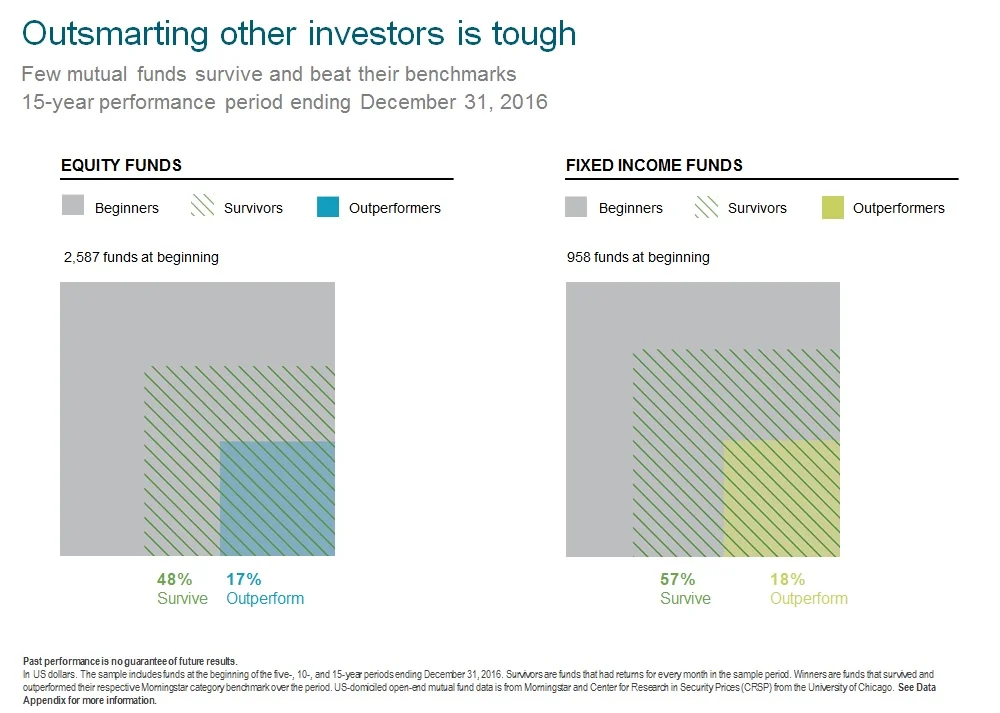
1. Let the markets work for you. Outsmarting other investors is tough, especially when you add in transaction costs. Invest in the broad markets, keep your transaction costs down, and structure your portfolio around expected dimensions of returns.

Outsmarting the Market 16.jpg

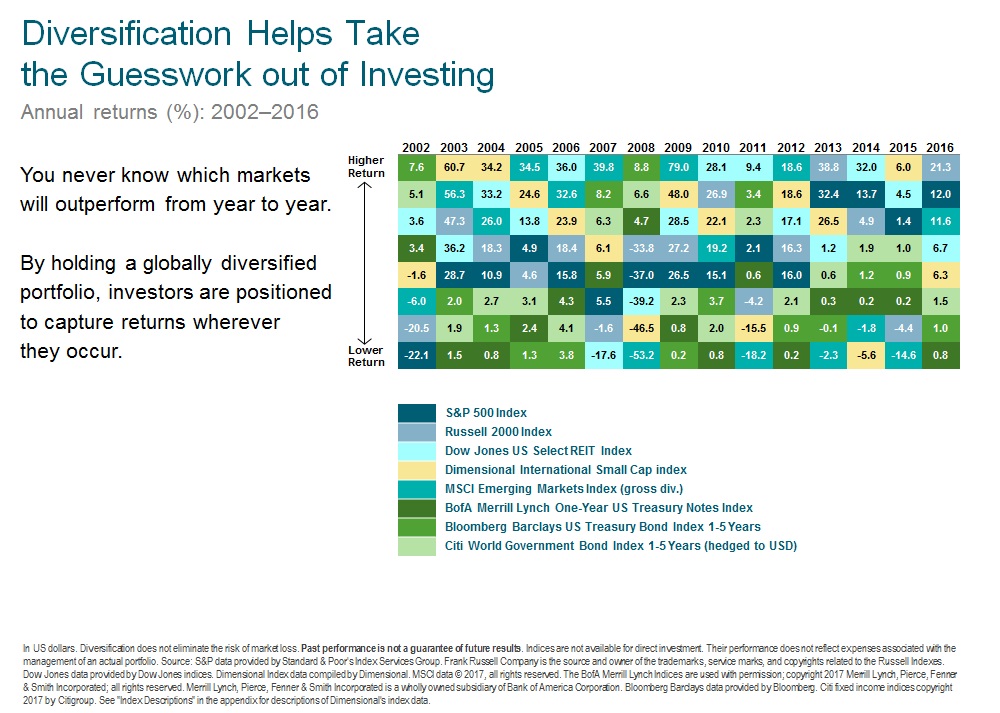
2. Diversify smartly. Diversification reduces risk that don't add to expected returns. Nearly half of the world's opportunities are outside the US.

Diversification 16.jpg

3. Have a plan. Investors are people that are subject to normal emotions. Having a plan in place that you can review when the going gets tough can make the difference in achieving your goals or not. Markets reward discipline.

Reacting can hurt 16.jpg

That's it, employ those three solutions and you will be well on your way to being a successful investor. Need help? Get in touch for a free review of your plan and portfolio.

Preparing to Get Hit by Life

Life is what happens to you while you’re busy making other plans,” John Lennon sang in a verse of Beautiful Boy. Mike Tyson put it more bluntly, “Everybody’s got plans…until they get hit.”[i]

I think back to my early 30’s when the .com bubble was expanding. Business was good in the financial trades, with stocks rising 20% every year and customers literally standing in line to invest. Retirement seemed a certainty by the time I was 40. Along the way, a new baby, a move to California, a “once in a generation” bear market, another baby, a move back to Texas, another “once in a generation” bear market, and a foolish notion to start a new business now have me approaching 50 and planning to work for the foreseeable future.

While some may argue differently about the bear markets, most would probably agree that none of those life events were catastrophic. But what if something had happened that truly altered my plans, or those of my family?

Probably the most obvious catastrophe that most people think of is an untimely demise. The odds of that happening are pretty low when you are in your 30’s. For example, according to the Social Security Administration's cohort life tables, a 30-year-old male has a 98.5% chance of living to age 40, 95.5% chance of making it to 50, and a 90.5% probability of reaching his 60th birthday. Ladies have even higher odds of reaching the golden years, with nearly a 94% chance. With odds that high, it isn’t surprising that term life insurance is relatively affordable.

Insurance works best when it is used to protect against low probability but high impact events, such as premature death. Nevertheless, paying an insurance company for 20-30 years of protection that is very unlikely to be used isn’t high on the list of expenses most folks look forward to paying. But the thought that our families would have to move because they can’t afford the mortgage or that the kids would be forced into debt to pay for college are enough to motivate me to write that check each year.

But there are other risks that are more likely to impact you than an early death. According to the SSA’s Disability and Death Probabilities, a male born in 1996 has about a 20% chance of becoming disabled before retirement age. Unlike death, with a disability you not only lose your earning potential but continue to need to support your family AND yourself.

Both life and disability insurance are important tools for protecting yourself from a knockdown blow, but they will cost you. How much you should buy can vary based on your personal goals, attitude towards risk, and family situation. An independent financial advisor may be your best resource for helping you answer the question of how much and then find solutions that suit you.

In addition, other steps to protect you and your family from a potential KO are:

Establish liquidity. An emergency fund with several months’ worth of expenses set aside is the easiest solution, but establishing credit before it is needed can also be effective. A line of credit or a credit card may be difficult to obtain or more expensive to use if you wait until the primary breadwinner has stopped winning bread.

Review the beneficiaries on your accounts and insurance policies. These designations work very efficiently to transfer assets after death without going through probate. However, failing to name them, or having the wrong ones (i.e. ex-spouses, minor children) can complicate or ruin your plans.

Write a will. Clearly state who should inherit your property and take care of your minor children, pets, etc. Appoint an executor that is willing and able to execute the will when the time comes.

Consider trusts. There is a myriad of trust types that accomplish different objectives. They can help avoid probate, protect assets from creditors, and insure they ultimately pass to the heirs or causes of your choosing.

Set up health care directives. Living wills, medical power of attorney, and HIPPA authorizations spell out your desires, who can make decisions, and who can even talk to doctors about your condition. These tools can insure that your wishes are followed in the event you aren’t able to communicate and help avoid emotional conflicts between well-meaning family members.

Establish durable power of attorney. In case you are unable to make financial decisions, having a trusted person (spouse, child, etc.) appointed as your attorney-in-fact that can handle your affairs can make life much easier on your family.

Title your assets correctly. All the steps previously mentioned can be voided or made more complicated by not titling assets correctly. On a financial statement, it is helpful to list the registration of all your assets so that your financial planner or attorney can help identify potential disconnects with your plans.

Finally, it’s also a good idea to put a recent copy of your financial statements, wills, trusts, insurance policies, deeds, and other important documents in a place where they can easily be accessed by your attorney-in-fact or executor.

Don’t know where to start? Get in touch to discuss your plans.


[i] https://www.brainyquote.com/quotes/quotes/m/miketyson379007.html?src=t_plans

Is the Market Due for a Wrench?

July marked the ninth consecutive month of positive returns in US stock markets. Rising tides lift all boats, but that hasn’t stopped some from taking credit.

Whose fault will it be when the inevitable downturn occurs? There will be plenty of blame offered, but you can be certain that at least one character won’t accept any of it. Believe me!

Since 1987, August has been the worst month for the S&P 500®, according to the Stock Trader’s Almanac. Also noted in the Almanac is that volatility typically picks up around this time of year. Given that the CBOE Volatility Index (also known as the VIX) hit its lowest level since 1990 last month, it wouldn’t be a shock to see some red numbers in the near term.

What also won’t be surprising is that someone will get credit for being the portfolio manager or trader that “predicted the selloff”, even though there is scant evidence of anyone consistently able to outguess the markets. In fact, in his 1973 book, A Random Walk Down Wall Street, Burton Malkiel argued, “A blindfolded monkey throwing darts at a newspaper’s financial pages could select a portfolio that would do just as well as one carefully selected by experts.”

But perhaps Mr. Malkiel was just observing (unknowingly) that expected returns actually increase by using this method to manage a portfolio. Sound crazy? Then check out this month’s Issue Brief from DFA titled Quit Monkeying Around!

Come to think of it, that might also be a suitable response to a certain Tweeter in Chief after his next late-night tirade. Rest assured, if the market wilts in the August heat, it may not be our fault but we’ll be right by your side with our Accountable Wealth Management. Get in touch if you would like to discuss.


Quit Monkeying Around!

August 2017

In the world of investment management there is an oft-discussed idea that blindfolded monkeys throwing darts at pages of stock listings can select portfolios that will do just as well, if not better, than both the market and the average portfolio constructed by professional money managers. If this is true, why might it be the case?

The Dart Board

Exhibit 1 shows the components of the Russell 3000 Index (regarded as a good proxy for the US stock market) as of December 31, 2016. Each stock in the index is represented by a box, and the size of each box represents the stock’s market capitalization (share price multiplied by shares outstanding) or “market cap” in the index. For example, Apple (AAPL) is the largest box since it has the largest market cap in the index. The boxes get smaller as you move from the top to the bottom of the exhibit, from larger stocks to smaller stocks. The boxes are also color coded based on their market cap and whether they are value or growth stocks. Value stocks have lower relative prices (as measured by, for instance the price-to-book ratio) and growth stocks tend to have higher relative prices. In the exhibit, blue represents large cap value stocks (LV), green is large cap growth stocks (LG), gray is small cap value stocks (SV), and yellow is small cap growth stocks (SG).

For the purposes of this analogy you can think of Exhibit 1 as a proxy for the overall stock market and therefore similar to a portfolio that, in aggregate, professional money managers hold in their competition with their simian challengers. Because for every investor holding an overweight to a stock (relative to its market cap weighting) there must also be an investor underweight that same stock, this means that, in aggregate, the average dollar invested holds a portfolio that looks like the overall market.[1]

Exhibit 1.       US Stocks Sized by Market Capitalization

For illustrative purposes only. Illustration includes constituents of the Russell 3000 Index as of December 31, 2016, on a market-cap weighted basis segmented into Large Value, Large Growth, Small Value, and Small Growth. Source: Frank Russell Compa…

For illustrative purposes only. Illustration includes constituents of the Russell 3000 Index as of December 31, 2016, on a market-cap weighted basis segmented into Large Value, Large Growth, Small Value, and Small Growth. Source: Frank Russell Company is the source and owner of the trademarks, service marks, and copyrights related to the Russell Indexes. Please see Appendix for additional information.

Exhibit 2, on the other hand, represents the dart board the monkeys are using to play their game. Here, the boxes represent the same stocks shown in Exhibit 1, but instead of weighting each company by market cap, the companies are weighted equally. For example, in this case, Apple’s box is the same size as every other company in the index regardless of its market cap. If one were to pin up pages of newspaper stock listings to throw darts at, Exhibit 2 would be much more representative of what the target would look like.

When looking at Exhibits 1 and 2, the significant differences between the two are clear. In Exhibit 1, the surface area is dominated by large value and large growth (blue and green) stocks. In Exhibit 2, however, small cap value stocks dominate (gray). Why does this matter? Research has shown that, historically over time, small company stocks have had excess returns relative to large company stocks. Research has also shown that, historically over time, value (or low relative price) stocks have had excess returns relative to growth (or high relative price) stocks. Because Exhibit 2 has a greater proportion of its surface area dedicated to small cap value stocks, it is more likely that a portfolio of stocks selected at random by throwing darts would end up being tilted towards stocks which research has shown to have had higher returns when compared to the market.

Exhibit 2.       US Stocks Sized Equally

For illustrative purposes only. Illustration includes the constituents of the Russell 3000 Index as of December 31, 2016 on an equal-weighted basis segmented into Large Value, Large Growth, Small Value, and Small Growth. Source: Frank Russell Compan…

For illustrative purposes only. Illustration includes the constituents of the Russell 3000 Index as of December 31, 2016 on an equal-weighted basis segmented into Large Value, Large Growth, Small Value, and Small Growth. Source: Frank Russell Company is the source and owner of the trademarks, service marks, and copyrights related to the Russell Indexes. Please see Appendix for additional information.

So…Throw Away?

This does not mean, however, that haphazardly selecting stocks by the toss of a dart is an efficient or reliable way to invest. For one thing, it ignores the complexities that arise in competitive markets.

Consider as an example something seemingly as straightforward as a strategy that holds every stock in the Russell 3000 Index at an equal weight (the equivalent of buying the whole dart board in Exhibit 2). In order to maintain an equal weight in all 3,000 securities, an investor would have to rebalance frequently, buying shares of companies that have gone down in price and selling shares that have gone up. This is because as prices change, so will each individual holding’s respective weight in the portfolio. By not considering whether or not these frequent trades add value over and above the costs they generate, investors are opening themselves up to a potentially less than desirable outcome.

Instead, if there are well-known relationships that explain differences in expected returns across stocks, using a systematic and purposeful approach that takes into consideration real-world constraints is more likely to increase your chances for investment success. Considerations for such an approach include things like: understanding the drivers of returns and how to best design a portfolio to capture them, what a sufficient level of diversification is, how to appropriately rebalance, and last but not least, how to manage the costs associated with pursuing such a strategy.


The Long Game

Finally, the importance of having an asset allocation well suited for your objectives and risk tolerance, as well as being able to remain focused on the long term, cannot be overemphasized. Even well-constructed portfolios pursuing higher expected returns will have periods of disappointing results. A financial advisor can help an investor decide on an appropriate asset allocation, stay the course during periods of disappointing results, and carefully weigh the considerations mentioned above to help investors decide if a given investment strategy is the right one for them.

Conclusion

So what insights can investors glean from this analysis? First, by tilting a portfolio towards sources of higher expected returns, investors can potentially outperform the market without needing to outguess market prices. Second, implementation and patience are paramount. If one is going to pursue higher expected returns, it is important to do so in a cost-effective manner and to stay focused on the long term.


Appendix

Large cap is defined as the top 90% of market cap (small cap is the bottom 10%), while value is defined as the 50% of market cap of the lowest relative price stocks (growth is the 50% of market cap of the highest relative price stocks). For educational and informational purposes only and does not constitute a recommendation of any security. The determinations of Large Value, Large Growth, Small Value, and Small Growth do not represent any determinations Dimensional Fund Advisors may make in assessing any of the securities shown.


[1]. For more on this concept, please see “The Arithmetic of Active Management” by William Sharpe.