Q2 2017 Market Review

As summer heats up, the US stock market stayed hot by posting its seventh consecutive quarter of positive returns. Much of that growth recently was led by large growth stocks, such as Facebook, Amazon, Netflix, and Alphabet (formerly known as Google); but small company growth stocks provided plenty of heat, too. Value stocks trailed growth stocks across all size ranges.

The Federal Reserve made no changes to monetary policy during the quarter but did start to release some of their discussions about how they may wind down the $4.5 trillion of bonds they bought with printed money following the Great Recession. While US and global bonds turned in a positive quarter, the tightrope between deflation and inflation that policy makers will be forced to traverse while unwinding the world central banks' unprecedented balance sheets would make even the Flying Wallendas nervous. All eyes are certain to be glued to Ms. Yellen and her global peers in coming months.

International markets, both developed and emerging, outperformed domestic markets, while commodities and REITs lagged. Longer maturity bonds and high yield corporates were the strongest performers in the fixed income markets, but the increasing noise about quantitative tightening has led to increased volatility.

It has been a good ride over the last couple of years. Long ago, I gave up trying to predict what the next short term moves in the market may be, but we should react to what market prices are telling us from time to time. Recently, we have rebalanced some portfolios due to drift from target allocations and aligned our models more closely to global equity weightings. While we all hope that Q3 produces a screen as green as Q2, at some point we will see red. By taking some gains off the table now, we hope to keep our clients in step with their risk tolerance and capacity while taking advantage of the benefits that diversification can provide.

If you have concerns about your portfolio or level of diversification, get in touch for a free review. In the meanwhile, stay cool and enjoy the Q2 2017 Market Review!

4 Letters Worth Repeating...Again

In early 2016, I was watching one of the cable business channels when a guest predicted that the stock market would crash on a particular day the following month. He even narrowed it down to what time of day the crash would occur.  

After discussing last week how different folks can arrive at very different conclusions when viewing the same data or charts, I was reminded of this article I wrote for the Accountable Update last year. The original, 4 Letters Worth Repeating, T-I-M-E, was good enough that I find it worth repeating, again. I did fix some questionable syntax and updated the charts with data through 2016. 

The article may be easier to read on ATXAdvisors.com than the email version due to the way some of the slides are formatted. Enjoy between the fireworks and BBQ this weekend and have a safe and Happy Independence Day! 


4 Letters Worth Repeating

This week, there was a story on a major "financial" network that predicted not only that the US stock market would peak on a particular day in March, but that it would happen after lunch. Appropriately, that network refers to itself with a 4-letter word.

But really, how considerate of them? With that level of detail, we should all be able to ride our unicorns down to Wall Street after sleeping late and enjoying a nice brunch, with time to spare to put in our sell orders before the bottom falls out.

I can think of a couple of 4-letter words for that kind of "news".

John Maynard Keynes is credited with uttering, “The market can stay irrational longer than you can stay solvent.” The famous (or infamous to some) economist made that observation after he had lost most of his money in ill-timed currency trades using borrowed money in early 1920. He was supposedly betting against the German Deutschmark as Deutschland struggled to recover after The Great War. Of course, in hindsight, he was right to see the black clouds building over the Weimer Republic that ultimately ended in hyperinflation and the rise of the National Socialist German Workers' Party (also known as the Nazis).

It turns out he was right about everything but, WHEN.

Decades later, investing legend Peter Lynch observed, "Far more money has been lost by investors preparing for corrections, or trying to anticipate corrections, than has been lost in corrections themselves." I suppose, though, that practical advice is much less likely to keep you glued to your TV set.

The reason it is so hard to know in the short run how any asset may perform is that the market reflects the aggregate expectations of all market participants, all the time. Folks that are willing to buy an asset are competing with folks who want to sell. When they agree on a price, they both feel that they are making the best deal. The buyer anticipating the asset will increase in price faster than other investment alternatives, the seller that the money will be more effectively invested elsewhere.

At ATX Portfolio Advisors, we believe that while the market incorporates all available information to drive stocks to fair value, we also believe that stocks may have different expected returns. In other words, there are certain characteristics that have resulted in returns that are greater than average that have persisted over time and across markets.

For stocks, there are four characteristics, or dimensions, that compelling evidence shows persistently over time. First is the market itself—stocks have higher expected returns than T-bills. Other characteristics include—company size (small vs. large), relative price (value vs. growth), and profitability (high vs. low).

The chart below documents the historical premiums that the size, relative price, and profitability dimensions have produced over time frames that reliable data is available. As you can see, the premiums have persisted over long time frames across different types of markets.

The next set of charts show the yearly relative performance of dimensions in US, Developed International, and Emerging Markets stocks. The blue bars indicate years in which the market, small cap, value, and profitability premiums were positive. The red bars indicate years in which the premiums were negative. A positive premium indicates out-performance (e.g., small cap stocks outperform large cap stocks); a negative premium indicates under-performance (e.g., small cap stocks under-perform large cap stocks).

Over these periods, positive premiums have occurred more frequently than negative premiums across all dimensions. BUT, the premiums can and do vary widely from year to year and can experience extreme and prolonged negative relative performance. In other words, there is no free brunch.

This is why we say you should take a longer-term view and stay disciplined during periods of volatility or under-performance of any premium. Over longer periods however, we have observed a higher frequency of positive premiums.

This next set documents the relative 5-year annualized performance of return dimensions in the different markets. When looking at longer time spans, observations of premiums are more consistent compared to one observation in any given year.

As you can see, there are fewer negative (red bars) 5-year periods versus positive (blue bars) periods. The difference is even more pronounced in historical observations of 10-year premiums as illustrated below.

Please remember that despite the higher frequency of positive premiums, outperformance may not be consistent, even over longer periods of time. Long-term investors should consider that premiums are never guaranteed and can undergo periods of negative returns in both relative and absolute terms.

All we have to do is look at the last 10-year period to remind ourselves of these facts, as many of the premiums have been smaller than historical averages.

10 Yr Dimension Performance.jpg

If the first several slides show why we stick to our strategy of owning the total market with weightings tilted to those dimensions that have demonstrated historical premiums, it is the last set that illustrates why our philosophy isn't likely to change when short term divergences from historical averages occur. They clearly show that the longer our investment period was, the more likely we were to see a premium in all of the dimensions. That's not nearly as exciting as screaming about market tops or bottoms, but it is pretty compelling evidence to stay the course no matter how loud the carnival barker chorus.

If nothing else, all of this reminds us of the old adage, “Time in the market is more important than timing the market.” T-I-M-E, now that's a 4-letter word worth worth repeating.

If you or someone you know lacks the time to plan and manage your portfolio, let's get acquainted.


Index descriptions available here.

Ink Blots or Evidence? Research Shows Profitability Matters

What Do You See.jpg

My morning routine, after coffee and exercise, is to review customer accounts for any needed actions, check emails, and if time allows, surf through several financial web sites. I look for news, insight, opinions, and occasional inspiration for Accountable Update articles. Yesterday, these two headlines stood out on one popular site:

  1. “This chart shows that stocks may be primed for a pullback”
  2. “Top strategist sees screaming 'buy' signal for stocks, here's the chart”

QUIZ: Can you guess which story the following charts were part of? (Answers can be found below)

Chart A

1498077814_20493351_TN_DIGITAL_CHART_LINE_A_BUY_v2.jpg

Chart B


It never ceases to amaze me that perfectly intelligent people believe that these financial Rorschach interpretations can somehow predict the future, despite overwhelming evidence that these techniques are only reliable at earning some active managers extra fees. What shouldn’t surprise anyone are the lengths people will go to convince others to pay them for no good reason, such as the ability to see illusory correlations in data.

Investing in the broad markets while overweighting investments with observable and persistent “premiums” is the type of evidence based investing I believe in. While chartists will tell you that recognizing repeatable patterns is a reliable way to determine when to buy or sell, I have yet to see any credible evidence suggesting that is the case. The headlines above illustrate the anecdotal nature of these techniques, as one of these “strategists” will certainly proclaim they were right, eventually.

A preferable approach, at least for me, is to start with well-diversified portfolios, then emphasize areas of the market with higher expected return potential. I can't make heads or tails (or is it shoulders?) from ink blots, but I did enjoy this Issue Brief from Dimensional that shows how one of these areas of higher potential, stocks that are currently profitable, was identified and tested through academic research.

Enjoy the slightly wonky read and get in touch if you would like an analysis of your portfolio that doesn’t involve a psychologist.

(Quiz Answers: Headline 1 goes with Chart B; Headline 2 goes with Chart A)


Evolution of Financial Research:
The Profitability Premium

Since the 1950s, there have been numerous breakthroughs in the field of financial economics that have benefited both society and investors.

One early example, resulting from research in the 1950s, is the insight that diversification can increase an investor’s wealth. Another example, resulting from research in the 1960s, is that market prices contain up-to-the-minute, relevant information about an investment’s expected return and risk. This means that market prices provide our best estimate of a security’s value. Seeking to outguess market prices and identify over- and undervalued securities is not a reliable way to improve returns.

This long history of innovation in research continues into the present day. As academics and market participants seek to better understand security markets, insights from their research can enable investors to better pursue their investment goals. In this article, we will focus on a series of recent breakthroughs into the relation between a firm’s profitability and its stock returns. As we will see, an important insight Dimensional drew from this research is how profitability and market prices can be used to increase the expected returns of a stock portfolio without having to attempt to outguess market prices.

DIFFERENCES IN EXPECTED RETURNS

The price of a stock depends on a number of variables. For example, one variable is what a company owns minus what it owes (also called book value of equity). Expected profits, and the discount rate investors apply to these profits, are others. This discount rate is the expected return investors demand for holding the stock. The impact of market participants trading stocks is that market prices quickly find an equilibrium point where the expected return of a stock is commensurate with what investors demand.

Decades of theoretical and empirical research have shown that not all stocks have the same expected return. Stated simply, investors demand higher returns to hold some stocks and lower returns to hold others. Given this information, is there a systematic way to identify those differences?

OBSERVING THE UNOBSERVABLE: CURRENT AND FUTURE PROFITABILITY

Market prices and expected future profits contain information about expected returns. While we can readily observe market prices as stocks are traded (think about a ticker tape scrolling across a television screen), we cannot observe market expectations for future profits or future profitability, which is profits divided by book value. So how can we use an unobserved variable to tell us about expected returns?

A paper by Professors Eugene Fama and Kenneth French published in 2006[1] tackles this problem. Fama and French have authored more than 160 papers. They both rank within the top 10 most-cited fellows of the American Finance Association[2] and in 2013, Fama received a Nobel Prize in Economics Science for his work on securities markets.

Fama and French explored which financial data that is observable today contain information about expected future profitability. They found that a firm’s current profitability contains information about its profitability many years hence. What insights did Dimensional glean from this? Current profitability contains information about aggregate investor’s expectations of future profitability.

MEASURING PROFITABILITY

The next academic breakthrough on profitability research was done by Professor Robert Novy-Marx, a world-renowned expert on empirical asset pricing. Building on the work of Fama and French, he explored the relation of different measures of current profitability to stock returns.

Profits equal revenues minus expenses. One particularly important insight Dimensional took from Novy-Marx’s work is that not all current revenues and expenses have information about future profits. For example, firms sometimes call a revenue or expense “extraordinary” when they do not expect it to recur in the future. If those revenues or expenses are not expected to recur, should investors expect them to contain information about future profitability? Probably not.

This is what Novy-Marx found when conducting his research. In a paper published in 2013,[3] he used US data since the 1960s and a measure of current profitability that excluded some non-recurring costs so that it could be a better estimate for expected future profitability. In doing so, he was able to document a strong relation between current profitability and future stock returns. That is, firms with higher profitability tended to have higher returns than those with low profitability. This is referred to as a profitability premium.

Around the same time, the Research team at Dimensional was also conducting research into profitability. They extended the work of Fama and French and found that in developed and emerging markets globally, current profitability has information about future profitability and that firms with higher profitability have had higher returns than those with low profitability. They also found that this observation held true when using different ways of measuring current profitability. These robustness checks are important to show that the profitability premiums observed in the original studies were not just due to chance.

Their research indicated that when using current profitability to increase the expected returns of a real-world strategy, it is important to have a thoughtful measure of profitability that provides a complete picture of a firm’s expenses while excluding revenues and expenses that may be unusual and therefore not expected to persist in the future.

THE CUTTING EDGE: NEW RESEARCH

Many papers documenting profitability premiums globally have been written since 2013. An exciting forthcoming paper[4] by Professor Sunil Wahal provides powerful out-of-sample US evidence of profitability premiums. Wahal is an expert in market microstructure (how stocks trade) and empirical asset pricing.

Fama, French, and Novy-Marx’s research on profitability used US data from 1963 on. Why? Because when they conducted their research, reliable machine-readable accounting statement data required to compute profitability for US stocks was only available from 1963 on. Hand-collecting and cleaning accounting statement data and then transcribing it in a reliable fashion is no easy task and presents many a challenge for any researcher.

Wahal rose to those challenges. He gathered a team of research assistants to hand-collect accounting statement data from Moody’s Manuals from 1940 to 1963. By applying his (and his team’s) expertise in accounting, combined with a great deal of meticulous data checking, Wahal was able to produce reliable profitability data for all US stocks from 1940 to 1963. Using this data to measure the return differences between stocks with high vs. low profitability, Wahal found similar differences in returns to what had been found in the post-1963 period.

This research provides compelling evidence of the profitability premium pre-1963 and is a powerful out-of-sample test that strengthens the results found in earlier work.

THE SIZE OF THE PROFITABILITY PREMIUM

So how large has the profitability premium been historically? Large enough that investors who want to increase expected returns in a systematic way should take note. Exhibit 1 shows empirical evidence of the profitability premium in the US and globally. In the US, between 1964 and 2016, the Dimensional US High Profitability Index and the Dimensional US Low Profitability Index had annualized compound returns of 12.55% and 8.23%, respectively. The difference between these figures, 4.32%, is a measure of the realized profitability premium in the US over the corresponding time period. The non-US developed market realized profitability premium was 4.51% between 1990 and 2016. In emerging markets, the realized profitability premium was 5.21% between 1996 and 2016.


Exhibit 1: The Profitability Premium

Profitability is measured as operating income before depreciation and amortization minus interest expense scaled by book. Indices are not available for direct investment. Their performance does not reflect the expenses associated with the management…

Profitability is measured as operating income before depreciation and amortization minus interest expense scaled by book. Indices are not available for direct investment. Their performance does not reflect the expenses associated with the management of an actual portfolio. Past performance is not a guarantee of future results. Index returns are not representative of actual portfolios and do not reflect costs and fees associated with an actual investment. Actual returns may be lower. See “Index Descriptions” in the appendix for descriptions of Dimensional and Fama/French index data. Eugene Fama and Ken French are members of the Board of Directors for and provide consulting services to Dimensional Fund Advisors LP.

CONCLUSION

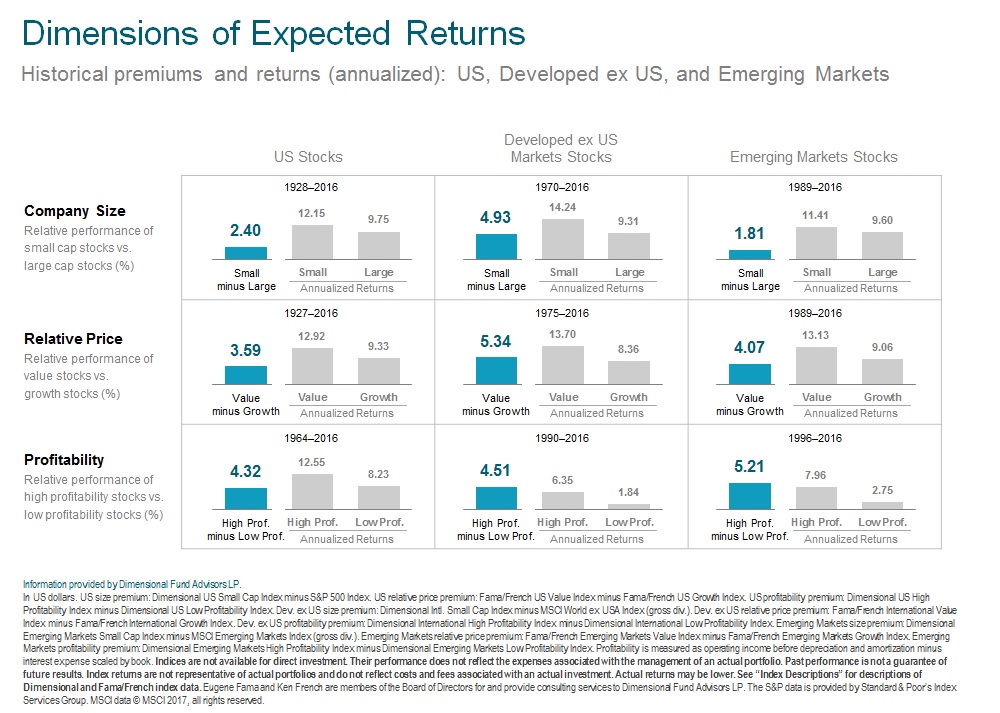
In summary, there are differences in expected returns across stocks. Variables that tell us what an investor has to pay (market prices) and what they expect to receive (book equity and future profits) contain information about those expected returns. All else equal, the lower the price relative to book value and the higher the expected profitability, the higher the expected return.

What Dimensional has learned from its own work and the work of Professors Fama, French, Novy-Marx, and Wahal, as well as others, is that current profitability has information about expected profitability. This information can be used in tandem with variables like market capitalization or price-to-book ratios to extract the differences in expected returns embedded in market prices. As such, it allows investors to increase the expected return potential of their portfolio without trying to outguess market prices.


[1]. Eugene Fama and Kenneth French, “Profitability, Investment, and Average Returns,” Journal of Financial Economics, vol. 82 (2006), 491–518.

[2]. G. William Schwert and Renè Stulz, “Gene Fama’s Impact: A Quantitative Analysis,” (working paper, Simon Business School, 2014, No. FR 14-17).

[3]. Robert Novy-Marx, “The Other Side of Value: The Gross Profitability Premium,” Journal of Financial Economics, vol. 108 (2013), 1–28.

[4]. Sunil Wahal, “The Profitability and Investment Premium: Pre-1963 Evidence,” (December 29, 2016). Available at SSRN: ssrn.com/abstract=2891491.


GLOSSARY

Book Value of Equity: The value of stockholder’s equity as reported on a company’s balance sheet.

Discount Rate: Also known as the “required rate of return” this is the expected return investors demand for holding a stock.

Out-of-sample: A time period not included or directly examined in the data series used in a statistical analysis.

Market Microstructure: The examination of how markets function in a fine level of detail, this can include areas of inquiry such as: how traders interact, how security orders are placed and cleared and how information is relayed and priced.

Empirical Asset Pricing: A field of study that uses theory and data to understand how assets are priced.

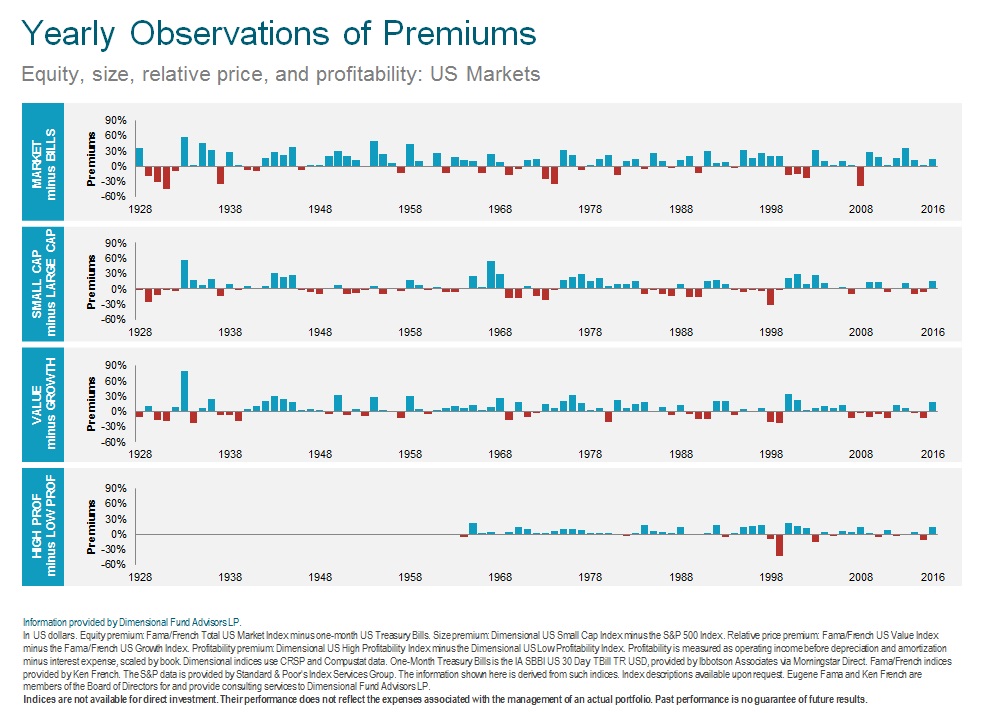
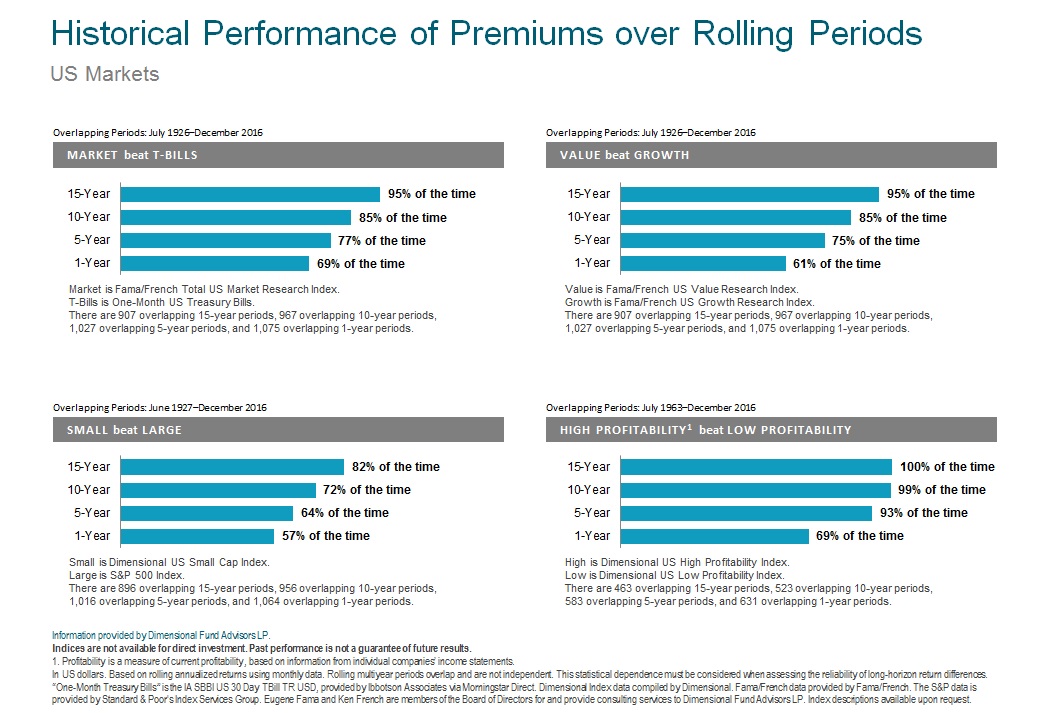
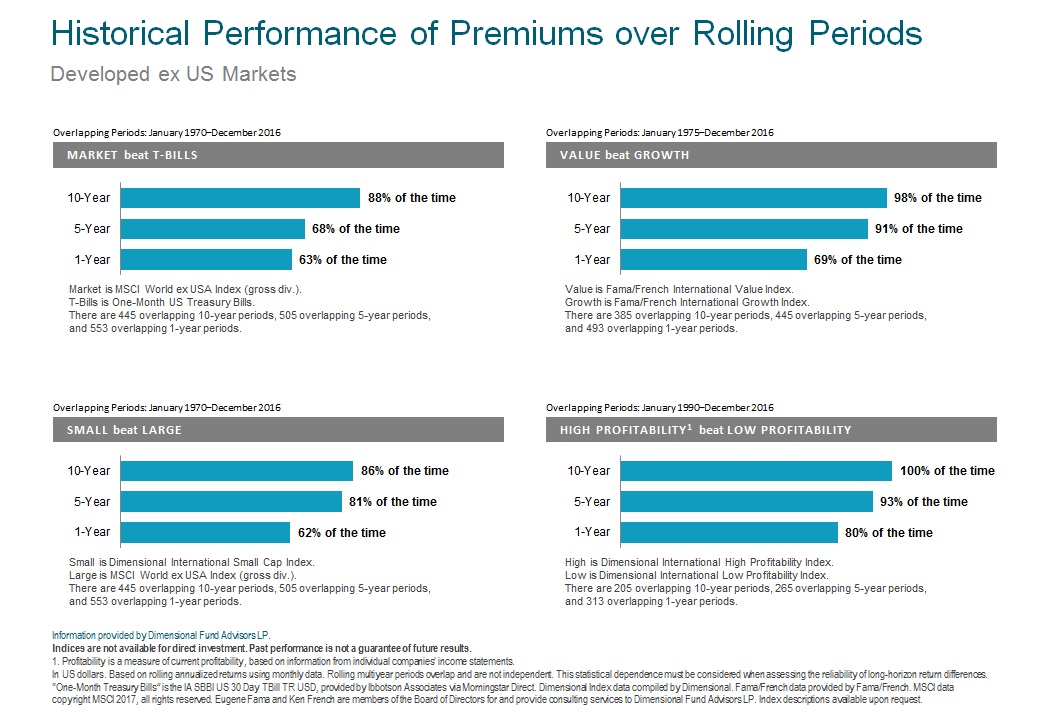
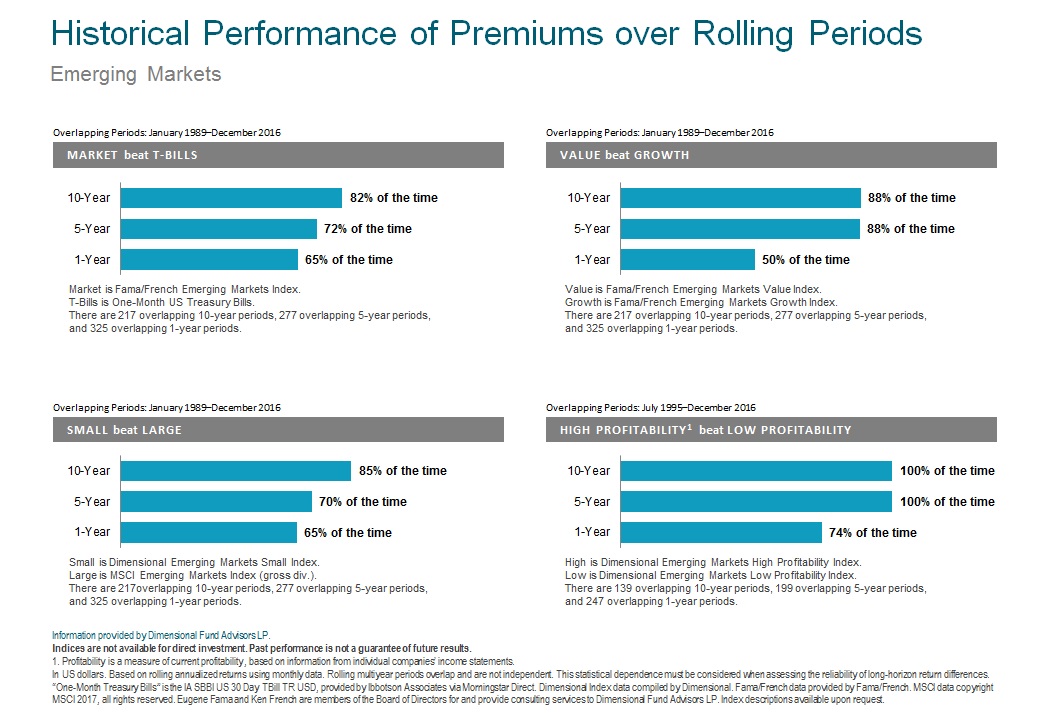
Profitability Premium: The return difference between stocks of companies with high profitability over those with low profitability.

Realized Profitability Premium: The realized, or actual, return difference in a given time period between stocks of companies with high profitability over those with low profitability.


INDEX DESCRIPTIONS

Dimensional US Low Profitability Index was created by Dimensional in January 2014 and represents an index consisting of US companies. It is compiled by Dimensional. Dimensional sorts stocks into three profitability groups from high to low. Each group represents one-third of the market capitalization. Similarly, stocks are sorted into three relative price groups. The intersections of the three profitability groups and the three relative price groups yield nine subgroups formed on profitability and relative price. The index represents the average return of the three low-profitability subgroups. It is rebalanced twice per year. Profitability is measured as operating income before depreciation and amortization minus interest expense scaled by book. Source: CRSP and Compustat.

Dimensional US High Profitability Index was created by Dimensional in January 2014 and represents an index consisting of US companies. It is compiled by Dimensional. Dimensional sorts stocks into three profitability groups from high to low. Each group represents one-third of the market capitalization. Similarly, stocks are sorted into three relative price groups. The intersections of the three profitability groups and the three relative price groups yield nine subgroups formed on profitability and relative price. The index represents the average return of the three high-profitability subgroups. It is rebalanced twice per year. Profitability is measured as operating income before depreciation and amortization minus interest expense scaled by book. Source: CRSP and Compustat.

Dimensional International Low Profitability Index was created by Dimensional in January 2013 and represents an index consisting of non-US developed companies. It is compiled by Dimensional. Dimensional sorts stocks into three profitability groups from high to low. Each group represents one-third of the market capitalization of each eligible country. Similarly, stocks are sorted into three relative price groups. The intersections of the three profitability groups and the three relative price groups yield nine subgroups formed on profitability and relative price. The index represents the average return of the three low-profitability subgroups. The index is rebalanced twice per year. Profitability is measured as operating income before depreciation and amortization minus interest expense scaled by book. Source: Bloomberg.

Dimensional International High Profitability Index was created by Dimensional in January 2013 and represents an index consisting of non-US developed companies. It is compiled by Dimensional. Dimensional sorts stocks into three profitability groups from high to low. Each group represents one-third of the market capitalization of each eligible country. Similarly, stocks are sorted into three relative price groups. The intersections of the three profitability groups and the three relative price groups yield nine subgroups formed on profitability and relative price. The index represents the average return of the three high-profitability subgroups. The index is rebalanced twice per year. Profitability is measured as operating income before depreciation and amortization minus interest expense scaled by book. Source: Bloomberg.

Dimensional Emerging Markets Low Profitability Index was created by Dimensional in April 2013 and represents an index consisting of emerging markets companies and is compiled by Dimensional. Dimensional sorts stocks into three profitability groups from high to low. Each group represents one-third of the market capitalization of each eligible country. Similarly, stocks are sorted into three relative price groups. The intersections of the three profitability groups and the three relative price groups yield nine subgroups formed on profitability and relative price. The index represents the average return of the three low-profitability subgroups. The index is rebalanced twice per year. Profitability is measured as operating income before depreciation and amortization minus interest expense scaled by book. Source: Bloomberg.


Dimensional Emerging Markets High Profitability Index was created by Dimensional in April 2013 and represents an index consisting of emerging markets companies and is compiled by Dimensional. Dimensional sorts stocks into three profitability groups from high to low. Each group represents one-third of the market capitalization of each eligible country. Similarly, stocks are sorted into three relative price groups. The intersections of the three profitability groups and the three relative price groups yield nine subgroups formed on profitability and relative price. The index represents the average return of the three high-profitability subgroups. The index is rebalanced twice per year. Profitability is measured as operating income before depreciation and amortization minus interest expense scaled by book. Source: Bloomberg.


Source: Dimensional Fund Advisors LP.

The Dimensional Indices have been retrospectively calculated by Dimensional Fund Advisors LP and did not exist prior to their index inceptions dates. Accordingly, results shown during the periods prior to each Index’s index inception date do not represent actual returns of the Index. Other periods selected may have different results, including losses. Backtested index performance is hypothetical and is provided for informational purposes only to indicate historical performance had the index been calculated over the relevant time periods. Backtested performance results assume the reinvestment of dividends and capital gains.

There is no guarantee investment strategies will be successful. Diversification does not eliminate the risk of market loss.

All expressions of opinion are subject to change. This article is distributed for informational purposes, and it is not to be construed as an offer, solicitation, recommendation, or endorsement of any particular security, products, or services.

Eugene Fama is a member of the Board of Directors for and provides consulting services to Dimensional Fund Advisors LP. He is a professor of finance at the University of Chicago, Booth School of Business. In 2013, he received a Nobel Prize for his work on securities markets.

Ken French is a member of the Board of Directors for and provides consulting services to Dimensional Fund Advisors LP. He is a professor of finance at the Tuck School of Business at Dartmouth College.

Robert Novy-Marx provides consulting services to Dimensional Fund Advisors LP. He is a professor of finance at the University of Rochester, Simon Business School.

Sunil Wahal provides consulting services to Dimensional Fund Advisors LP. He is a professor of finance at Arizona State University, Carey School of Business.


[1]. Eugene Fama and Kenneth French, “Profitability, Investment, and Average Returns,” Journal of Financial Economics, vol. 82 (2006), 491–518.

[2]. G. William Schwert and Renè Stulz, “Gene Fama’s Impact: A Quantitative Analysis,” (working paper, Simon Business School, 2014, No. FR 14-17).

[3]. Robert Novy-Marx, “The Other Side of Value: The Gross Profitability Premium,” Journal of Financial Economics, vol. 108 (2013), 1–28.

[4]. Sunil Wahal, “The Profitability and Investment Premium: Pre-1963 Evidence,” (December 29, 2016). Available at SSRN: ssrn.com/abstract=2891491.