
Accountable Update

Deadlines, Elections, and Markets

Exhibit 1.

Exhibit 1.

Hardly a day goes by lately that one of the candidates for President (okay, mostly just one of the them) doesn't do or say something that makes you shake your head. Just this week, the "Donald" got confused and encouraged a group of Florida voters to head to the polls on November 28, only three weeks after the actual election! 

To help you avoid being disenfranchised, or worse, here are a couple of important upcoming dates to keep in mind:

Monday, October 17 – There are a number of deadlines next Monday.

Final Deadline for Individual Federal Income Tax Returns: nationwide final deadline for filing an individual federal income tax return for tax year 2015 after having filed for an extension. Extensions also apply to:

  • Removal of Excess Contributions and Roth IRA Conversion Recharacterization: last day to remove excess retirement contributions or to recharacterize a Roth IRA conversion from 2015.
  • SEP and SIMPLE IRA Contributions: 2015 contributions for Qualified Retirement Plans (QRP), Simplified Employee Pension Individual Retirement Account (SEP IRA), and Employer Savings Incentive Match Plan for Employees (SIMPLE) IRA.

If you have questions about these retirement issues, get in touch today to discuss your situation.

Tuesday, November 8 – Election Day, even in Florida.

Understandably, the election is causing consternation for many of the folks I talk to.  Elections add uncertainty, and uncertain markets act, well, uncertainly. We won’t know for sure for a few more weeks, but recent polls have increasingly indicated that the Democrats will keep the White House. Barring a WikiLeaks trove of Hillary’s lost love letters (or emails) from Vladimir Putin, maybe it’s time to look back at some of the items in President Obama’s last budget for clues to what may be coming down the pike and plan accordingly.

For some insight into elections and their impact on markets, the following Issue Brief[i] shows how making investment decisions based on the outcome of presidential elections is unlikely to result in reliable excess returns for investors. At best, any positive outcome will likely be the result of random luck. At worst, it can lead to costly mistakes.


Presidential Elections and the Stock Market

Next month, Americans will head to the polls to elect the next president of the United States. While the outcome is unknown, one thing is for certain: There will be a steady stream of opinions from pundits and prognosticators about how the election will impact the stock market. As we explain below, investors would be well‑served to avoid the temptation to make significant changes to a long‑term investment plan based upon these sorts of predictions.

SHORT-TERM TRADING AND PRESIDENTIAL ELECTION RESULTS

Trying to outguess the market is often a losing game. Current market prices offer an up-to-the-minute snapshot of the aggregate expectations of market participants. This includes expectations about the outcome and impact of elections. While unanticipated future events—surprises relative to those expectations—may trigger price changes in the future, the nature of these surprises cannot be known by investors today. As a result, it is difficult, if not impossible, to systematically benefit from trying to identify mispriced securities. This suggests it is unlikely that investors can gain an edge by attempting to predict what will happen to the stock market after a presidential election.

Exhibit 1 (above) shows the frequency of monthly returns (expressed in 1% increments) for the S&P 500 Index from January 1926 to June 2016. Each horizontal dash represents one month, and each vertical bar shows the cumulative number of months for which returns were within a given 1% range (e.g., the tallest bar shows all months where returns were between 1% and 2%). The blue and red horizontal lines represent months during which a presidential election was held. Red corresponds with a resulting win for the Republican Party and blue with a win for the Democratic Party. This graphic illustrates that election month returns were well within the typical range of returns, regardless of which party won the election.

LONG-TERM INVESTING: BULLS & BEARS ≠ DONKEYS & ELEPHANTS

Predictions about presidential elections and the stock market often focus on which party or candidate will be “better for the market” over the long run. Exhibit 2 shows the growth of one dollar invested in the S&P 500 Index over nine decades and 15 presidencies (from Coolidge to Obama). This data does not suggest an obvious pattern of long-term stock market performance based upon which party holds the Oval Office. The key takeaway here is that over the long run, the market has provided substantial returns regardless of who controlled the executive branch.

Exhibit 2.

Exhibit 2.

CONCLUSION

Equity markets can help investors grow their assets, but investing is a long-term endeavor. Trying to make investment decisions based upon the outcome of presidential elections is unlikely to result in reliable excess returns for investors. At best, any positive outcome based on such a strategy will likely be the result of random luck. At worst, it can lead to costly mistakes. Accordingly, there is a strong case for investors to rely on patience and portfolio structure, rather than trying to outguess the market, in order to pursue investment returns.


[i] Source: Dimensional Fund Advisors LP.

All expressions of opinion are subject to change. This information is intended for educational purposes, and it is not to be construed as an offer, solicitation, recommendation, or endorsement of any particular security, products, or services.

Diversification does not eliminate the risk of market loss. Investment risks include loss of principal and fluctuating value. There is no guarantee an investing strategy will be successful.

Past performance is not a guarantee of future results. Indices are not available for direct investment; therefore, their performance does not reflect the expenses associated with the management of an actual portfolio. The S&P data is provided by Standard & Poor’s Index Services
Q3 2016 Market Review

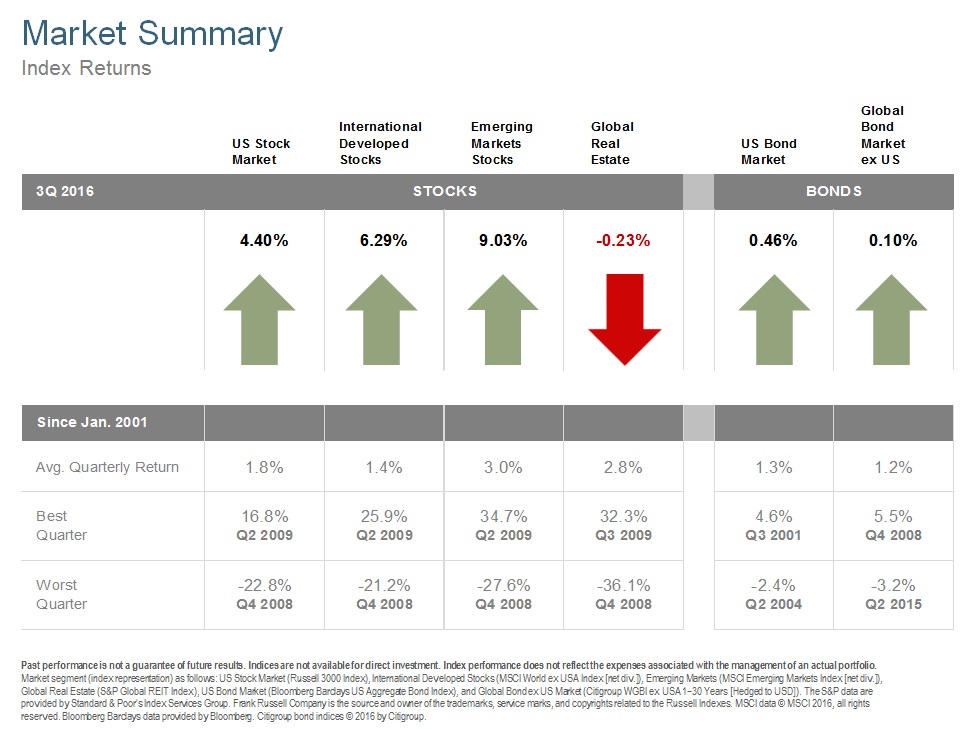
Despite the uncertainty created by the still tight presidential election, stocks and bonds generally had positive returns for the quarter, with the Dow, S&P 500, and NASDAQ all setting record highs. As the quarter was coming to a close, the omnipresent question of when, or if, central banks will end their "do no harm" mode in favor of raising rates here in the US or continuing to ease them in Europe and Japan led to some volatility.

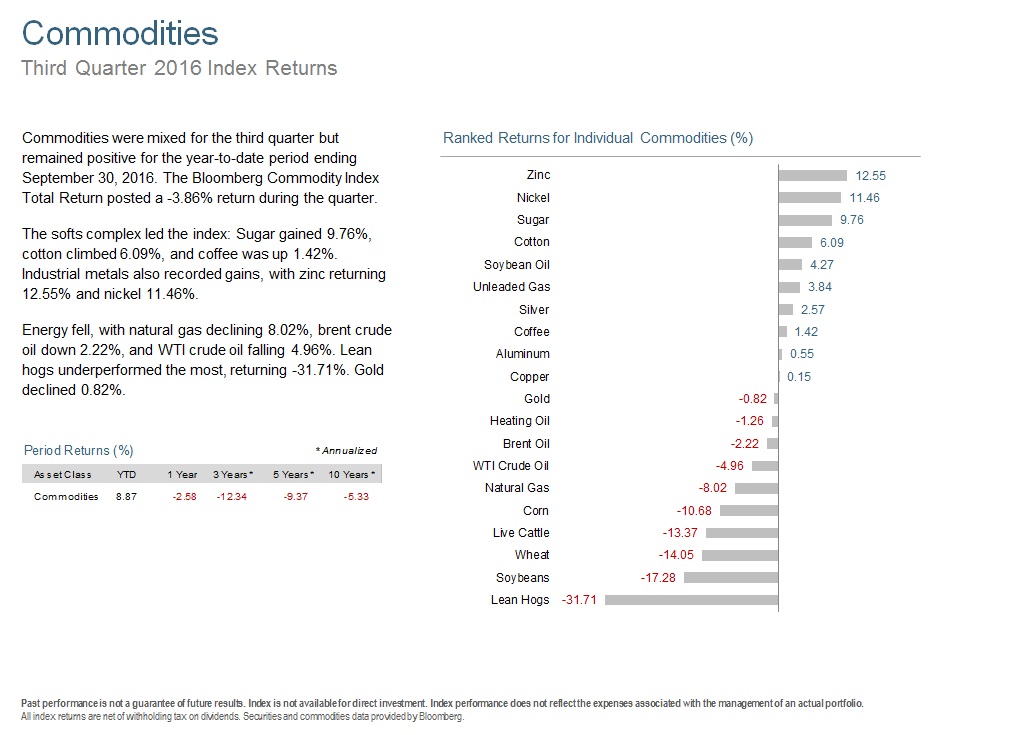
Small cap stocks were the best performing asset class, which usually bodes well for economic growth. Not surprisingly, REITs, which should be sensitive to rising rates, were weaker during the quarter. However, commodities, which you may expect to rise with inflation expectations, were mixed.

As has been the case over the past few years, the guessing game of trying to differentiate temporary reversion to the mean against longer term trends proved to be anyone’s guess. This is why I avoid “tactical” approaches to investing for long term goals, because it is essentially making a guess.

Historically, there are more up days in the stock market than down days. There are also more up months versus down months and more up years versus down years. Betting against the house is a losing proposition. Worse, even if you guess correctly on a short term drop, you have to guess again on the reversal in order to profit.

Just as the odds of the ball landing on red don’t change even if it landed on black each of the last dozen spins, the last eight months of positive returns don’t increase the odds that next month will be down. Be thankful for the string of positive returns and when we see the next downturn, remain steadfast in the knowledge that the odds favor staying the course.

Now, for the Q3 2016  Market Review...


Jump or Ease In? Lump Sum Versus Dollar Cost Averaging

The Water is Fine

The Autumnal Equinox, aka the first day of Fall, was last week on September 22. You may not have noticed, as the high for the day was 94° F here in ATX. Yesterday, though, we woke to the first day in over six months that the thermometer read below 60°. This became VERY apparent when I stuck my toes in the water prior to my morning swim at our neighborhood pool.

Even though most will agree that jumping in and getting the initial shock over with is typically the best way to acclimate to cool water, it can be difficult to convince our minds that a more cautious approach isn’t more prudent after getting cold feet.

Frequently this dilemma also presents itself with investing. The question of whether to “jump in” the market and invest immediately versus employing a more gradual approach such as dollar cost averaging regularly comes up in my conversations with clients that have cash to invest. So what is the best approach?

12 time Olympic medalist, Natalie Coughlin, was once quoted as saying, "I actually love swimming but I just hate jumping in the water." If even the most successful pros face the same mental challenges as the rest of us, maybe the question isn't which approach is best. Rather, what does it take to get you in the pool?

First, let’s not confuse the question of what to do with a lump-sum versus accumulating wealth over time. If you don’t have a lot of money to invest and want to start by taking small amounts from your income (such as in an employer retirement plan like a 401(k)) and investing over time, by all means, do that. It is an effective way to grow your nest egg.

But if you have already saved up a pile of cash or had a liquidity event and want to invest for the long haul, decades of research[i] suggest that investing it all at once, or lump-sum investing, tilts the odds in your favor around 66% of the time. Nonetheless, that 66% is a lot like 66° water for a lot of folks. Some have the fortitude to jump right in, others need to convince themselves through a more cautious approach.

Stocks and bonds have expected returns that are higher than cash, so it stands to reason that the odds favor them to outperform over time. Another way to think about it is that for 2 out 3 investors, increasing stock and bond prices will just lead to higher average prices paid through dollar cost averaging (See exhibit 1). However, volatility is the trade-off for those higher expected returns.

Exhibit 1: For 2 out 3 investors, dollar cost averaging will increase the average price paid as stock and bond prices tend to go up over time.

Exhibit 1: For 2 out 3 investors, dollar cost averaging will increase the average price paid as stock and bond prices tend to go up over time.

If the prospect of being on the short end of the stick about a third of the time is just too uncomfortable of a thought for you to jump right in, then dollar cost averaging may be the way to go. Besides, just as you can always dunk your head in the water to get it over with, you can accelerate your investment schedule if you acclimate sooner than you expected.

Either approach is better than staying in bed while your muscles wither from inactivity or purchasing power is diminished by inflation.  Time for a swim?


[i] Abeysekera, Sarath P., and E.S. Rosenbloom. 2000. “A Simulation Model for Deciding between Lump-Sum and Dollar-Cost Averaging.” Journal of Financial Planning 13 (6): 86–96.

Atra, Robert J., and Thomas L. Mann. 2001. “Dollar-Cost Averaging and Seasonality: Some International Evidence.” Journal of Financial Planning 14 (7): 98–103.

Brennan, Michael J., Feifei Li, and Walter N. Torous. 2005. “Dollar-Cost Averaging.” Review of Finance 9 (4): 509–535.

Constantinides, George M. 1979. “A Note on the Suboptimality of Dollar-Cost Averaging as an Investment Policy.” Journal of Financial and Quantitative Analysis 14 (2): 443–450.

Dichtl, Hubert, and Wolfgang Drobetz. 2011. “Dollar-Cost Averaging and Prospect Theory Investors: An Explanation for a Popular Investment Strategy.” Journal of Behavioral Finance12 (3): 41–52.

Dubil, Robert. 2005. “Lifetime Dollar-Cost Averaging: Forget Cost Savings, Think Risk Reduction.” Journal of Financial Planning 18 (10): 86–90.

Greenhut, John G. 2006. “Mathematical Illusion: Why Dollar-Cost Averaging Does Not Work.” Journal of Financial Planning 19 (10): 76–83.

Knight, John R., and Lewis Mandell. 1993. “Nobody Gains from Dollar-Cost Averaging: Analytical, Numerical, and Empirical Results.” Financial Services Review 2 (1): 51–61.

Leggio, Karyl B., and Donald Lien. 2001. “Does Loss Aversion Explain Dollar-Cost Averaging?” Financial Services Review 10 (1–4): 117–127.

Leggio, Karyl B., and Donald Lien. 2003. “Comparing Alternative Investment Strategies Using Risk-Adjusted Performance Measures.” Journal of Financial Planning 16 (1): 82–86.

Markowitz, Harry. 1952. “Portfolio Selection.” Journal of Finance 7 (1): 77–91.

Milevsky, Moshe A., and Steven E. Posner. 2003. “A Continuous-Time Re-examination of the Inefficiency of Dollar-Cost Averaging.” International Journal of Theoretical and Applied Finance 6 (2): 173–194.

Rozeff, Michael S. 1994. “Lump-Sum Investing versus Dollar-Averaging.” Journal of Portfolio Management 20 (2): 45–50.

Statman, Meir. 1995. “A Behavioral Framework for Dollar-Cost Averaging.” Journal of Portfolio Management 22 (1): 70–78.

Thorley, Steven. 1994. “The Fallacy of Dollar-Cost Averaging.” Financial Practice and Education 4 (2): 138–143.

Trainor, William J. 2005. “Within-Horizon Exposure to Loss for Dollar-Cost Averaging and Lump-Sum Investing.” Financial Services Review 14 (4): 319–330.

Williams, Richard E., and Peter W. Bacon. 1993. “Lump-Sum Beats Dollar-Cost Averaging.”Journal of Financial Planning 6 (2): 64–67.