

Photo by tudor-rose
I'm always looking for ideas for the Accountable Update. Sometimes an idea may not warrant a full post, but may still be interesting (at least to me) or have merit. This week will be the first in what will probably be a once or twice per month version of the Update where I'll cover several shorter topics or links to material I'd like to share with our readers. The subjects will vary widely.
After considering several titles, I landed on calling these entries, "Flingin' it", as in spaghetti on a wall, mud, or other things you may find in a pasture. I hope it doesn't get too deep.
Do recent GDP estimates spell doom?
If you were really bored, had insomnia, or are a market wonk, you probably noticed that the Bureau of Economic Analysis (BEA) released an estimate of Q1 2016 US GDP growth on April 28. If you are like the rest of us, it may have slipped by unnoticed. I'm sure the suspense is killing you, so before I lose you to a frantic Google search I'll tell you what it was...
.5% (or annualized 2%).
Does that look kind of low? It should, because that is below the historical average of 3.2%, according to the BEA. Does that mean it is time to start stuffing the mattresses? Probably not.
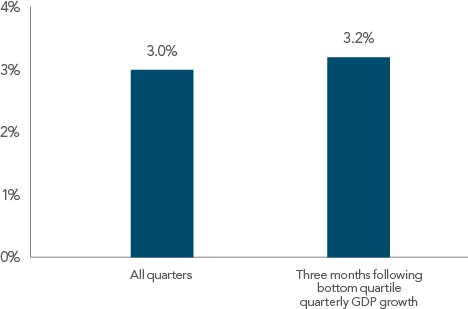
The following chart shows that the average quarterly return for the S&P 500 Index from 1948-2016 was 3%. In quarters following lowest quartile GDP growth, the average quarterly return was 3.2%! So is this a buy signal?
Quarterly S&P 500 Index Returns, 1948–2016
Sources: S&P Dow Jones Indices, Bureau of Economic Analysis.
Past performance is not a guarantee of future results. Indices are not available for direct investment; therefore, their performance does not reflect the expenses associated with the management of an actual portfolio.
Not if you believe, as I do, that current stock prices reflect all current information. With the average quarterly returns following poor GDP being very close to the average of all quarters, perhaps we can move on to more interesting reading next time we can't sleep!
The Long and Short of it
Hardly a week goes by that I'm not approached by a salesperson about including their "alternative" strategy in the Accountable Portfolios℠. The pitches are sometimes very compelling. Higher returns, lower volatility, with little correlation to more traditional assets. Some of these alternatives undoubtedly offer some benefit, but are those benefits superior to methods such as those that ATX Portfolio Advisors embraces? More to the point, are they worth the extra expense?
Eugene Fama and Ken French explore two such type of alternative approaches on the Fama/French Forum. Long/Short Strategies in the May 10th entry and Portable Alpha on May 5th answer those questions.
Can Negative Rates be Positive?
With countries like Japan and Germany experiencing negative interest rates on their bonds as a result of market forces and/or central bank policies, it is reasonable to wonder why anyone would willingly buy a bond that is going to pay back less than you put in.
In the last piece, I've linked an Issue Brief from Dimensional Funds, Finding Positive Expected Returns in a Negative Rate Environment. It discusses that hedging the currencies of foreign bond issuers can not only control volatility but may also lead to positive expected returns, even when rates are negative.
That's enough for this week. If any of it sticks with you, get in touch if you would like to discuss!