Accountable Update

Quick Announcement

I'm taking a break from the Accountable Update this week due to a travel conflict, but I do have an announcement to share. Taigon Chen is the newest addition to the team at ATX Portfolio Advisors, beginning this week as my first intern.

Taigon is a sophomore at the University of Texas, majoring in Aerospace Engineering and Business Administration. He is from Sugarland where he was Valedictorian of William B. Travis High School. In his spare time, he enjoys trading stocks, designing and building airplanes and computers, and playing the guitar. 

Taigon will be focused on learning about investments and financial planning, as well as some of the technology and operational aspects of the business. Please join me in welcoming Taigon!

Getting What You Don’t Pay For

Please consider the investment objectives, risks, charges, and expenses carefully before investing in Mutual Funds. The prospectus, which contains this and other information about the investment company, can be obtained directly from the Fund Company or your financial professional. Be sure to read the prospectus carefully before deciding whether to invest.

Does that sound familiar? If you scroll to the bottom of this webpage, you will see this common language encouraging you to read the prospectus of any mutual fund you are considering for purchase. But even if you heed the call to read this legally required disclosure, you probably aren't seeing the whole picture.

For example, did you know that funds also produce another document that discloses how much the fund pays in trading commissions? Those expenses are not included in the fund's expense ratio and are typically expressed as a dollar amount on a financial statement that can be found in the Statement of Additional Information (SAI).

This is just one example of the type of diligence that you, or an advisor on your behalf, should be conducting when considering the inclusion of mutual funds and Exchange Traded Funds(ETFs) in your portfolio. Funds and ETFs are required to produce these disclosures in prescribed formats. Throw in holdings reports, typically produced semi-annually but sometimes more frequently, and you have the information you need to start making informed decisions.

This week I share the July 2017 Issue Brief from DFA titled Getting What You Don't Pay For. It provides a quick insight into why the information found in documents such as prospectuses and SAIs matters. Enjoy the short read and have a great weekend!


Getting What You Don’t Pay For

Costs matter. Whether you’re buying a car or selecting an investment strategy, the costs you expect to pay are likely to be an important factor in making any major financial decision.

People rely on a lot of different information about costs to help inform these decisions. When you buy a car, for example, the sticker price tells you approximately how much you can expect to pay for the car itself. But the sticker price is only one part of the overall cost of owning a car. Other things like sales tax, the cost of insurance, expected routine maintenance costs, and the potential cost of unexpected repairs are also important to understand. Some of these costs are easily observed, and others are more difficult to assess. Similarly, when investing in mutual funds, different variables need to be considered to evaluate how cost‑effective a strategy may be for a particular investor.

Expense Ratios

Many types of costs lower the net return available to investors. One important cost is the expense ratio. Similar to the sticker price of a car, the expense ratio tells you a lot about what you can expect to pay for an investment strategy. Exhibit 1 helps illustrate why expense ratios are important and shows how hefty expense ratios can impact performance.

This data shows that funds with higher average expense ratios had lower rates of outperformance. For the 15-year period through 2016, only 9% of the highest-cost equity funds outperformed their benchmarks. This data indicates that a high expense ratio is often a challenging hurdle for funds to overcome, especially over longer horizons. From the investor’s point of view, an expense ratio of 0.25% vs. 0.75% means savings of $5,000 per year on a $1 million account. As Exhibit 2 helps to illustrate, those dollars can really add up over longer periods.


Exhibit 1.       High Costs Can Reduce Performance, Equity Fund Winners and Losers Based on Expense Ratios (%)

Exhibit 2.       Hypothetical Growth of $1 Million at 6%, Less Expenses

The sample includes funds at the beginning of the 15-year period ending December 31, 2016. Funds are sorted into quartiles within their category based on average expense ratio over the sample period. The chart shows the percentage of winner and loser funds by expense ratio quartile; winners are funds that survived and outperformed their respective Morningstar category benchmark, and losers are funds that either did not survive or did not outperform their respective Morningstar category benchmark. US-domiciled open-end mutual fund data is from Morningstar and Center for Research in Security Prices (CRSP) from the University of Chicago. Equity fund sample includes the Morningstar historical categories: Diversified Emerging Markets, Europe Stock, Foreign Large Blend, Foreign Large Growth, Foreign Large Value, Foreign Small/Mid Blend, Foreign Small/Mid Growth, Foreign Small/Mid Value, Japan Stock, Large Blend, Large Growth, Large Value, Mid-Cap Blend, Mid-Cap Value, Miscellaneous Region, Pacific/Asia ex-Japan Stock, Small Blend, Small Growth, Small Value, and World Stock. For additional information regarding the Morningstar historical categories, please see “The Morningstar Category Classifications” at morningstardirect.morningstar.com/clientcomm/Morningstar_Categories_US_April_2016.pdf. Index funds and fund-of-funds are excluded from the sample. The return, expense ratio, and turnover for funds with multiple share classes are taken as the asset-weighted average of the individual share class observations. For additional methodology, please refer to Dimensional Fund Advisor’s brochure, The 2017 Mutual Fund Landscape. Past performance is no guarantee of future results.

For illustrative purposes only and not representative of an actual investment. This hypothetical illustration is intended to show the potential impact of higher expense ratios and does not represent any investor’s actual experience. Assumes a starting account balance of $1,000,000 and a 6% compound annual growth rate less expense ratios of 0.25% and 0.75% applied over a 15-year time horizon. Taxes and other potential costs are not reflected. Actual results may vary significantly. Changing the assumptions would result in different outcomes. For example, the savings and difference between the ending account balances would be lower if the starting investment amount was lower.


While the expense ratio is an important piece of information for an investor to evaluate, what matters most when gauging the true cost‑effectiveness of an investment strategy is the “total cost of ownership.” Similar to the car example, total cost of ownership is more holistic than any one figure. It looks at things that are readily observable, like expense ratios, but also at things that are more difficult to assess, like trading costs and tax impact. It is important for investors to be aware of these and other costs and to realize that an expense ratio, while useful, is not an all‑inclusive metric for total cost of ownership.

Trading Costs

For example, while an expense ratio includes the fund’s investment management fee and expenses for fund accounting and shareholder reporting (among other items), it doesn’t include the potentially substantial cost of trading securities within the fund. Overall trading costs are a function of the amount of trading, or turnover, and the cost of each trade. If a manager trades excessively, costs like commissions and the price impact from trading can eat away at returns. Viewed through the lens of our car analogy, this impact is similar to excessively jamming your brakes or accelerating quickly. By regularly demanding immediacy like this when it may not be necessary, the more wear and tear your car is likely to experience and the more fuel you will end up using. These actions can increase your total cost of ownership. Additionally, excessive trading can also lead to negative tax consequences for the fund, which can increase the cost of ownership for investors holding funds in taxable accounts. The best way to try to decrease the impact of trading costs is for funds to avoid trading excessively and pay close attention to effectively minimizing cost per trade. Employing a flexible investment approach that reduces the need for immediacy, thereby enabling opportunistic execution, is one way to potentially help accomplish this goal. Keeping turnover low, remaining flexible, and transacting only when the potential benefits of a trade outweigh the costs can help keep overall trading costs down and help reduce the total cost of ownership.

Conclusion

The total cost of ownership of a mutual fund can be difficult to assess and requires a thorough understanding of costs beyond what an expense ratio can tell investors on its own. A good advisor can help investors look beyond any one cost metric and instead evaluate the total cost of ownership of an investment program—and ultimately help clients decide if a given strategy is right for them.


Source: Dimensional Fund Advisors LP.

There is no guarantee investment strategies will be successful. Diversification does not eliminate the risk of market loss. Mutual fund investment values will fluctuate and shares, when redeemed, may be worth more or less than original cost. The types of fees and expenses will vary based on investment vehicle. Investments are subject to risk including possible loss of principal.

All expressions of opinion are subject to change. This article is distributed for informational purposes, and it is not to be construed as an offer, solicitation, recommendation, or endorsement of any particular security, products, or services.

Q2 2017 Market Review

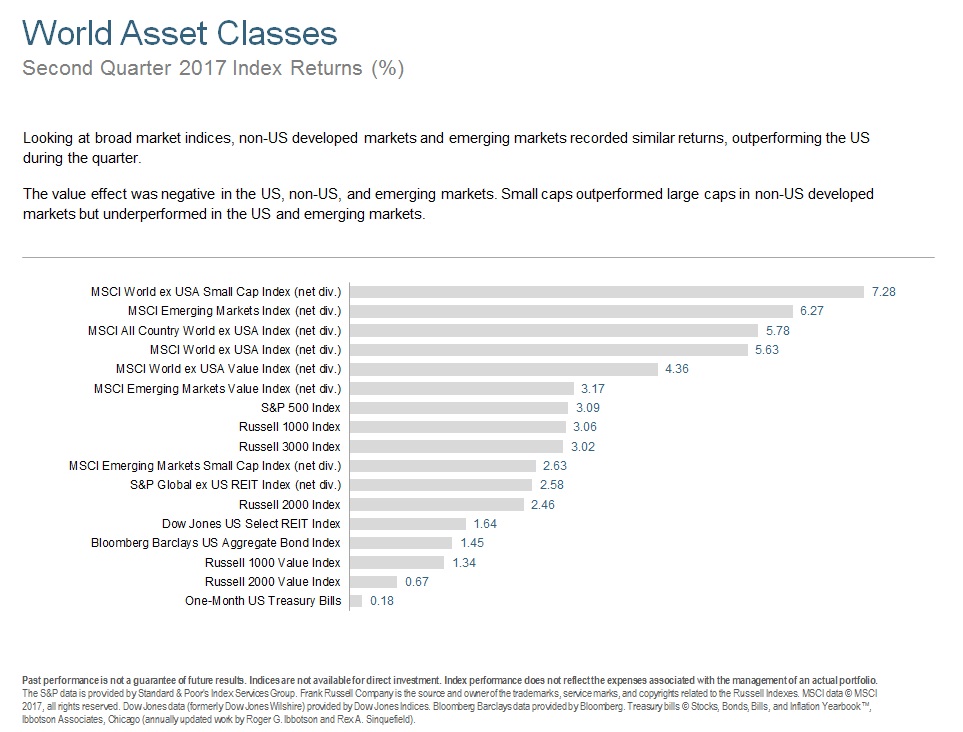
As summer heats up, the US stock market stayed hot by posting its seventh consecutive quarter of positive returns. Much of that growth recently was led by large growth stocks, such as Facebook, Amazon, Netflix, and Alphabet (formerly known as Google); but small company growth stocks provided plenty of heat, too. Value stocks trailed growth stocks across all size ranges.

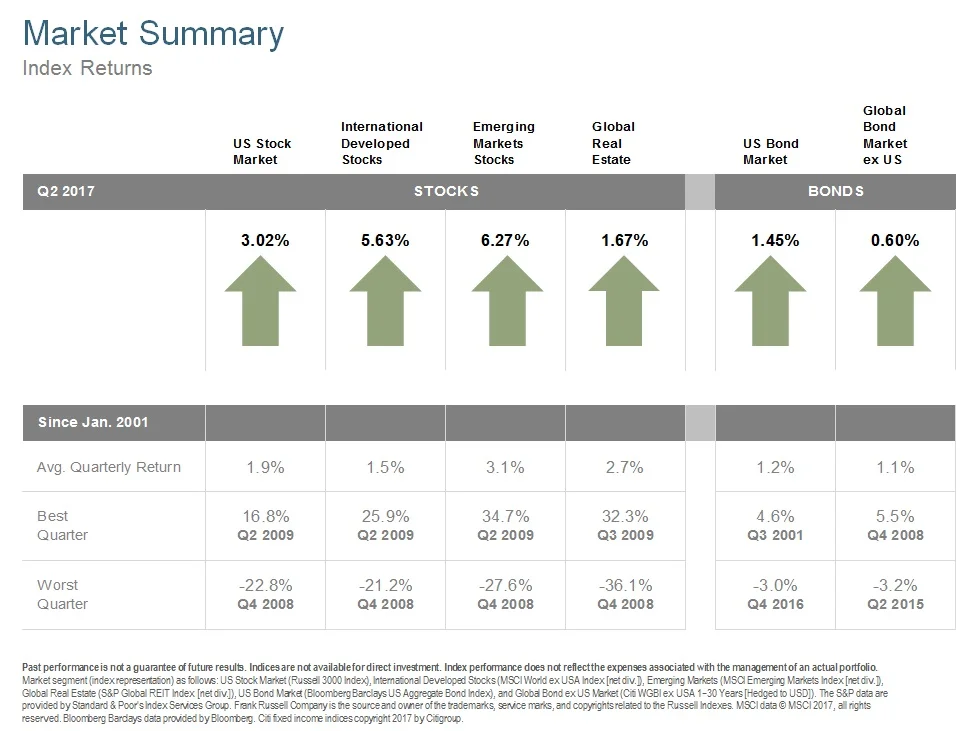
The Federal Reserve made no changes to monetary policy during the quarter but did start to release some of their discussions about how they may wind down the $4.5 trillion of bonds they bought with printed money following the Great Recession. While US and global bonds turned in a positive quarter, the tightrope between deflation and inflation that policy makers will be forced to traverse while unwinding the world central banks' unprecedented balance sheets would make even the Flying Wallendas nervous. All eyes are certain to be glued to Ms. Yellen and her global peers in coming months.

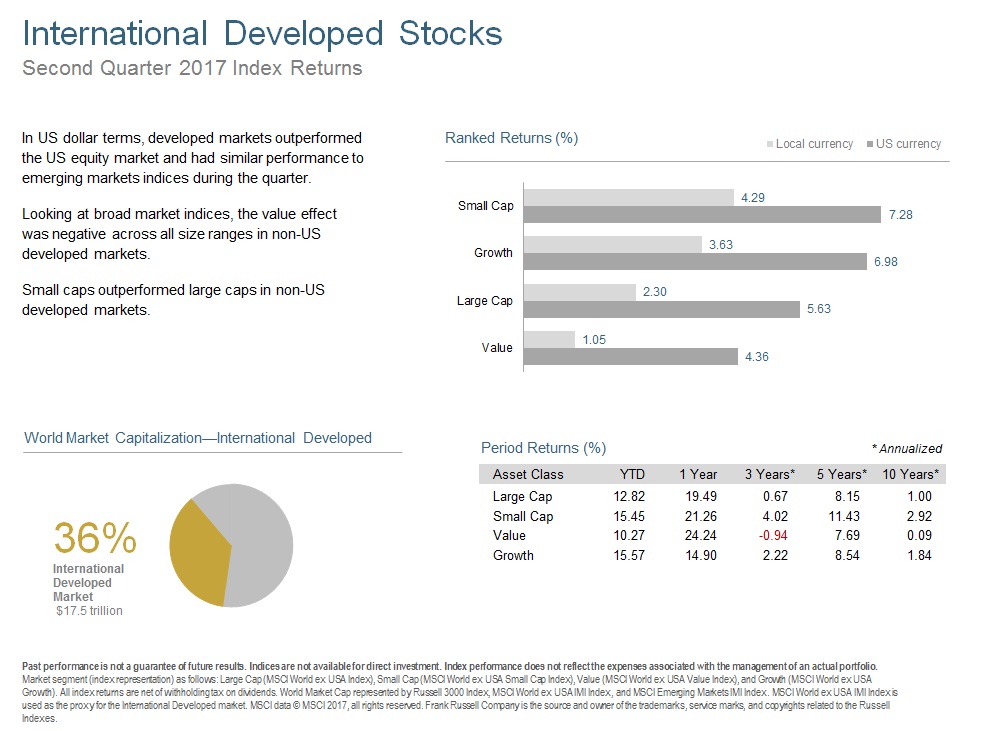
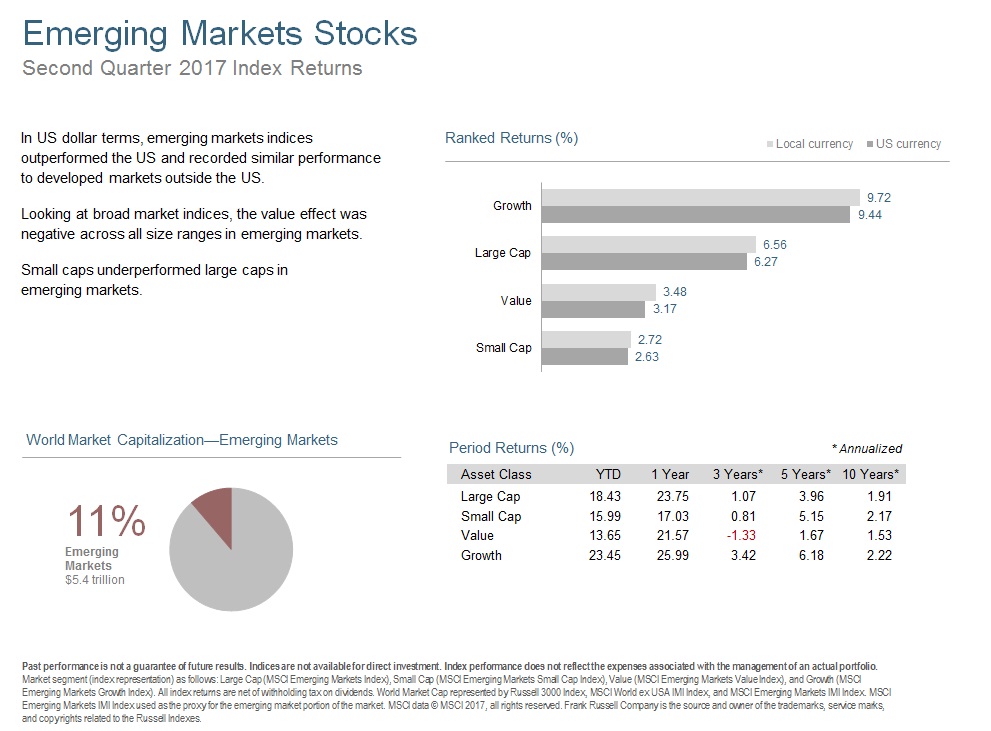
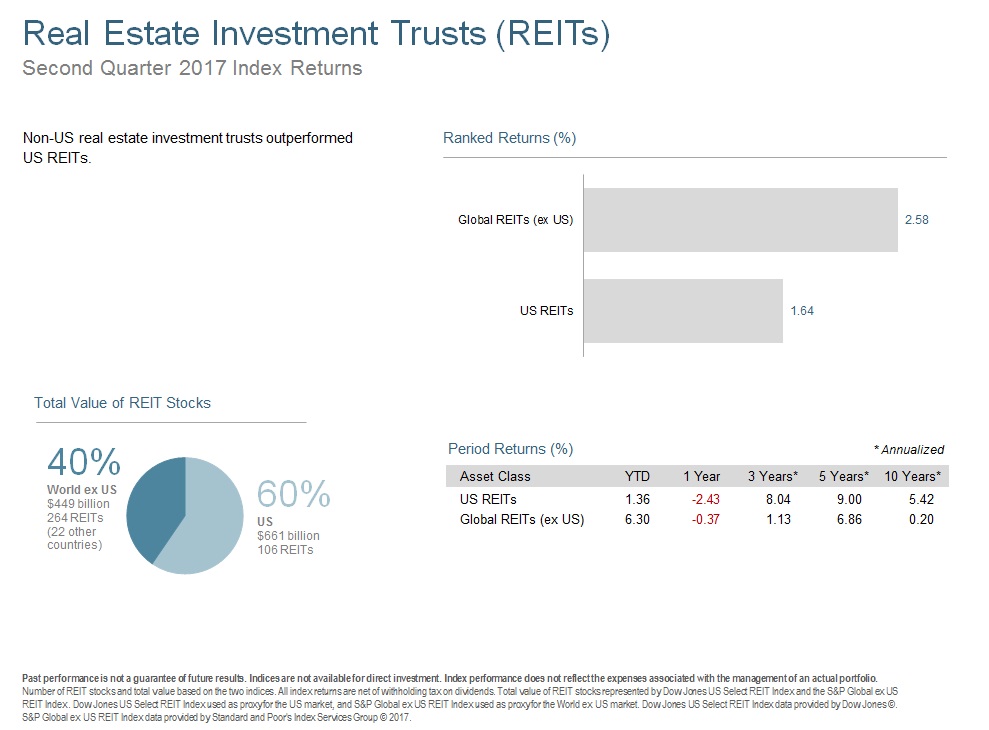
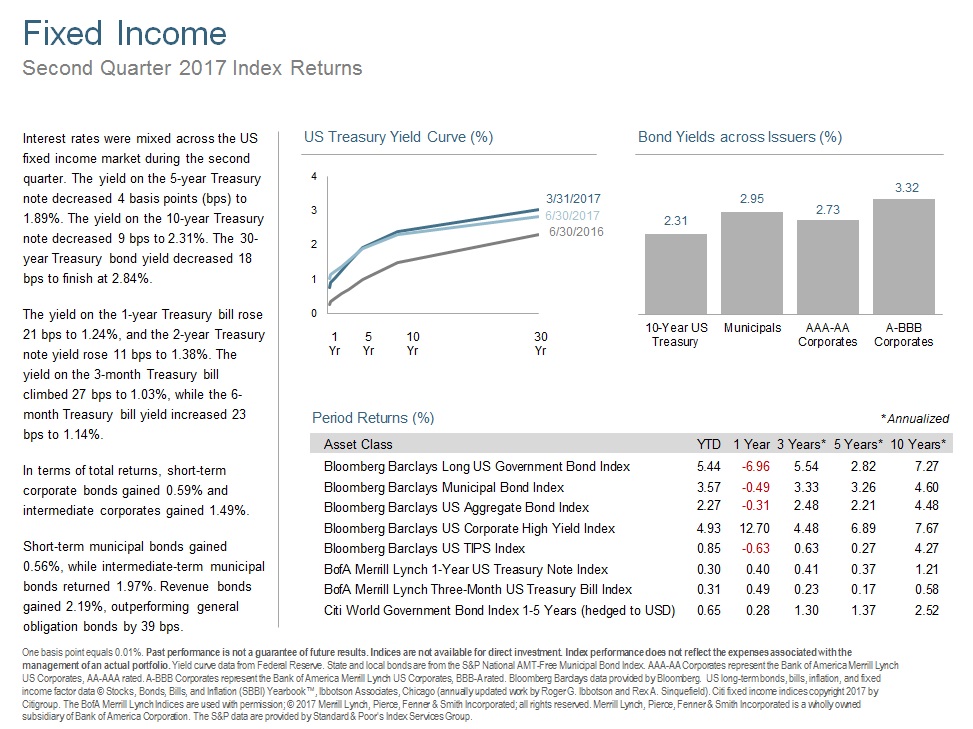
International markets, both developed and emerging, outperformed domestic markets, while commodities and REITs lagged. Longer maturity bonds and high yield corporates were the strongest performers in the fixed income markets, but the increasing noise about quantitative tightening has led to increased volatility.

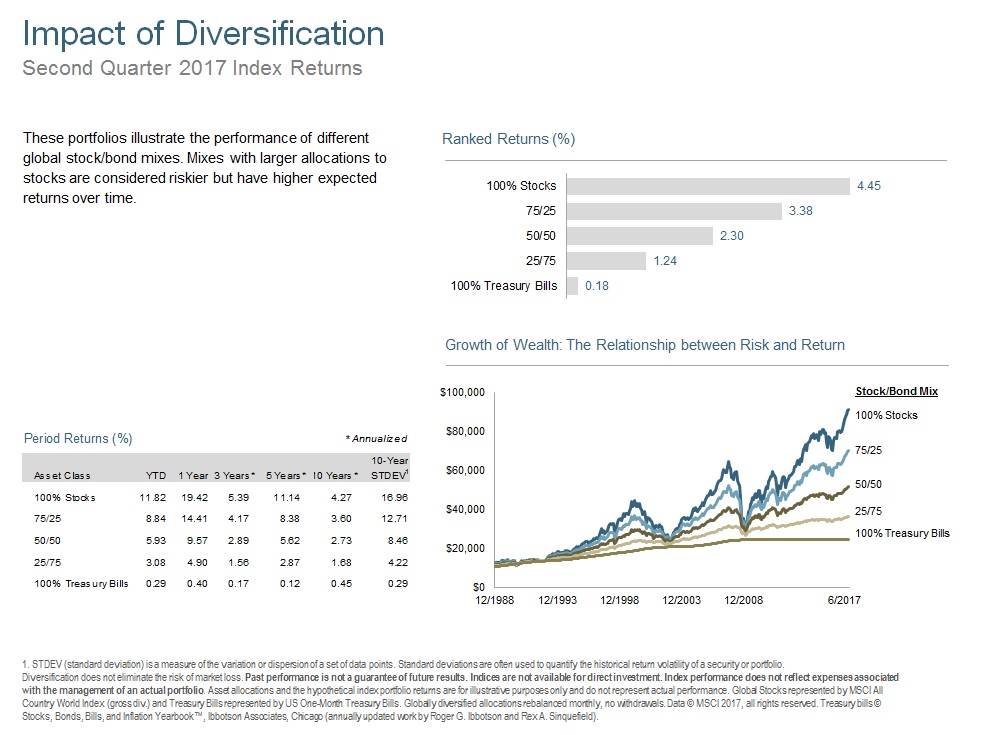
It has been a good ride over the last couple of years. Long ago, I gave up trying to predict what the next short term moves in the market may be, but we should react to what market prices are telling us from time to time. Recently, we have rebalanced some portfolios due to drift from target allocations and aligned our models more closely to global equity weightings. While we all hope that Q3 produces a screen as green as Q2, at some point we will see red. By taking some gains off the table now, we hope to keep our clients in step with their risk tolerance and capacity while taking advantage of the benefits that diversification can provide.

If you have concerns about your portfolio or level of diversification, get in touch for a free review. In the meanwhile, stay cool and enjoy the Q2 2017 Market Review!