In developed ex US markets, small cap stocks outperformed large cap stocks and value stocks outperformed growth stocks. Over both the five- and 10-year rolling periods, the small cap premium, measured as the MSCI World ex USA Small Cap Index minus the MSCI World ex USA Index, continued to be positive. The five- and 10-year rolling periods for the small cap premium have been positive for the better part of the past decade.
Value stocks outperformed growth stocks by 9.26%, as measured by the MSCI World ex USA Value Index minus the MSCI World ex USA Growth Index. Similarly to US small caps, most of the outperformance occurred in the fourth quarter, reinforcing the importance of consistency in pursuing premiums. Despite a positive year, the value premium remains negative over the five- and 10-year rolling periods.
Emerging Markets
In emerging markets, small cap stocks underperformed large cap stocks and value stocks outperformed growth stocks. Despite the underperformance of small cap stocks, small cap value stocks fared better than small cap growth stocks and performed similarly to large cap value stocks. Investors who emphasized small cap value stocks over small cap growth stocks benefited.
Fixed Income
Both US and non-US fixed income markets posted positive returns. The Bloomberg Barclays US Aggregate Bond Index gained 2.65%. The Bloomberg Barclays Global Aggregate Bond Index (hedged to USD) gained 3.95%.
Yield curves were generally upwardly sloped in many developed markets, indicating positive expected term premiums. Indeed, realized term premiums were positive in the US and globally as longer-term maturities outperformed their shorter-term counterparts.
Corporate bonds were the best performing sector, returning 6.11% in the US and 6.22% globally, as reflected in the Bloomberg Barclays Global Aggregate Bond Index (hedged to USD). Credit premiums were also positive in the US and globally as lower quality investment grade corporates outperformed their higher quality investment grade counterparts.
While interest rates increased in the US, they generally decreased globally. Major markets such as Japan, Germany, and the United Kingdom all experienced decreases in interest rates. In fact, yields on Japanese and German government bonds with maturities as long as eight years finished the year in negative territory.
In the US, interest rates increased the most on the short end of the yield curve and were relatively unchanged on the long end. The yield on the 3-month US Treasury bill increased 0.35% to end the year at 0.51%. The yield on the 2-year US Treasury note increased 0.14% to 1.20%. The yield on the 10-year US Treasury note closed at a record low of 1.37% in July yet increased 0.18% for the year to end at 2.45%. The yield on the 30-year US Treasury bond increased 0.05% to end the year at 3.06%.
Currencies
The British pound, euro, and Australian dollar declined relative to the US dollar, while the Canadian dollar and Japanese yen appreciated relative to the US dollar. The impact of regional currency differences on returns in the developed equity markets was minor in most cases. US investors in both developed and emerging markets generally benefited from exposure to certain currencies.
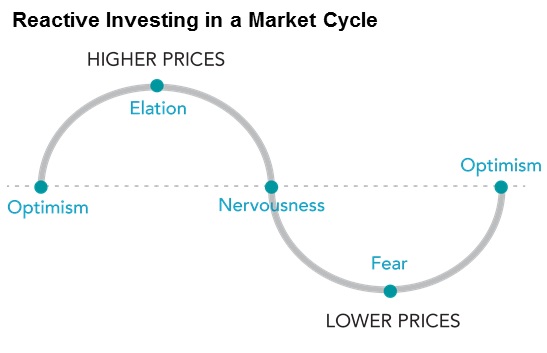
“There’s no information in past returns of three to five years. That’s just noise. It really takes very long periods of time, and it takes a lot of stick-to-it-iveness. You have to really decide what your strategy is based on long period of returns, and then stick to it.”
―Eugene Fama
[1] All non-US returns are in USD, net dividends.
[2] The VIX is a measure of implied volatility using S&P 500 option prices. Source: Bloomberg.
[3] The small cap premium is the return difference between small capitalization stocks and large capitalization stocks. The value premium is the return difference between stocks with low relative prices (value) and stocks with high relative prices (growth).
[4] Profitability is measured as a company’s operating income before depreciation and amortization minus interest expense scaled by book equity. The profitability premium is the return difference between stocks of companies with high profitability over those with low profitability.
[5] Profitability performance is measured as the top half of stocks based on profitability minus the bottom half in the Russell 3000 Index.
[6] A yield curve is a graph that plots the interest rates at a specific point in time of bonds with similar credit quality but different maturity dates.
Sources:
Frank Russell Company is the source and owner of the trademarks, service marks, and copyrights related to the Russell Indexes. Dow Jones data provided by Dow Jones Indices. MSCI data © MSCI 2017, all rights reserved. S&P data provided by Standard & Poor’s Index Services Group. The BofA Merrill Lynch Indices are used with permission; © 2017 Merrill Lynch, Pierce, Fenner & Smith Inc.; all rights reserved. Bloomberg Barclays data provided by Bloomberg. Indices are not available for direct investment; their performance does not reflect the expenses associated with the management of an actual portfolio.
Past performance is no guarantee of future results. This information is provided for educational purposes only and should not be considered investment advice or a solicitation to buy or sell securities.
Investing risks include loss of principal and fluctuating value. Small cap securities are subject to greater volatility than those in other asset categories. International investing involves special risks such as currency fluctuation and political instability. Investing in emerging markets may accentuate these risks. Sector-specific investments can also increase these risks.
Fixed income securities are subject to increased loss of principal during periods of rising interest rates. Fixed income investments are subject to various other risks, including changes in credit quality, liquidity, prepayments, and other factors. REIT risks include changes in real estate values and property taxes, interest rates, cash flow of underlying real estate assets, supply and demand, and the management skill and creditworthiness of the issuer.
Eugene Fama is a member of the Board of Directors for and provides consulting services to Dimensional Fund Advisors LP.
Dimensional Fund Advisors LP is an investment advisor registered with the Securities and Exchange Commission.